Showing posts with label variability. Show all posts

Sunday, April 26, 2009

Y&R: "Rating" the headwriters

[Click on the link below to see the full version, if it is trucated]

ETA. SON User Paul Raven was able to give me 1999 ratings, which fleshes out data for Kay Alden. The pattern of data was identical to what I had published in an earlier draft, but it gives me more confidence in the Alden results.

Photobucket

Last week at Daytime Confidential, writer Jamey Giddens wrote an eloquent review of Tom Casiello's first breakdown at Y&R. It was a terrific review, and I agree with almost all of it.

But a funny thing happened in the comment thread. Jamey and a user named Monamis got into a debate about the relative impact of Lynn Latham on the ratings. Monamis points out things really went south with current headwriter (HW) Maria Arena Bell took over, but Jamey Giddens argues that Latham lost a million viewers.

What is the truth? Well, it sounds like a data analysis, and that's my thing.

Here is what I did. I wanted to go back to the start of Kay Alden's regime as solo Headwriter, but Toups' ratings archive at Soap Opera Network only gives me weekly ratings as far back as 2000. Okay, I'd start there.

Because different tenures lasted different periods of time, I thought I should post average weekly changes. These represent the slope coefficients that result when the household (HH) ratings are regressed on week. They represent the single best way to express ratings change in a common metric, despite the varying writing tenures on the show.

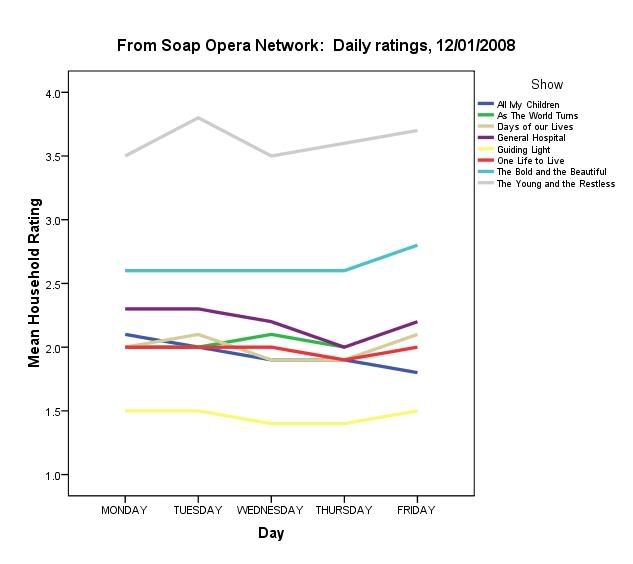
The figure at the top illustrates the data graphically. You can see that, as always, there was a lot of week to week variability. So, I am just extracting the linear trends from these data.

I divided the tenures this way:

Alden = Alden solo, before the arrival of Jack Smith
Smith = any period after Smith returned to the show, but before Latham joined
Latham = any period after she was formally named HW, even while Alden and Smith were still there
ArenaBell&Griffith = the disastrous (for ratings) period that began with the WGA writer's strike of 2007, and continued until Griffith's ouster in early 2008
ArenaBell = the post-Griffith period, in which she led a team that included Hogan Sheffer, Scott Hamner, and mahy others.

I further broke Latham's tenure into two pieces. 2006 was when she still had the legacy team (Alden, Smith, Ed Scott and many others) for most of it, and 2007, when she essentially had absolute control over her team without any "legacy" interference.

The table looks like this:


HW regime
Average weekly HH ratings change
Kay Alden
-0.010
Jack Smith with Kay Alden
-0.004
Lynn Latham (overall)
-0.003
Lynn Latham (2006 with legacy team)
+0.001
Lynn Latham (2007 without legacy team)
-0.006
Arena Bell/Griffth
-0.028
Arena Bell
+0.004


What do these numbers show?

It means the worst regime for the show was that Arena Bell/Griffth collaboration, that coincided with the WGA writer's strike and the sudde dismissal of Lynn Latham. Story-wise, the rushed introduction of Sabrina and her whirlwind romance with Victor seems to caused so much disgust that viewers tuned out in droves.

Alden's solo regime was next in problematic ratings. On average, she lost about 0.5 HH ratings points a year, which is a lot.

What that means is that the most disastrous period in the Toups/SON ratings archive is the several month period in which Arena Bell was writing with Josh Griffith. During this period, which encompassed the writer's strike and brief period thereafter, there were non-trivial declines on a week-by-week basis. "Bleeding". Many internet bloggers/message boarders blame this on the "damaged ground" that these writers inherited from Latham, but the descent was so precipitous, I have to believe that the introduction the much-younger Sabrina and Victor's whirlwind romance with her provoked a "disgust" response that led to massive tuneout.

More impressive is that in the time since Griffith left, Arena has actually stemmed the bleeding, and she is the only HW since Bill Bell to show ratings GROWTH.Now the growth is actually fairly anemic (.004 HH ratings points per week, on average), but in this climate, any growth is breath-taking.

Ratings-wise, the second-most difficult period in the post-Bell era was Kay Alden's solo regime, at least in the period beginning with 2000. Every ten weeks, on average, the show could be expected to lose 0.1 ratings points, or about 0.5 ratings points a year.

It seems that Alden's collaboration with Smith stemmed the tide...during this period, a much slower rate of decline set in.

And here is where it gets interesting. Latham was brough into shake things up. But, overall, her weekly rate of ratings decline (-.003) was only trivially different from the Smith & Alden era. She was not any more destructive to the ratings than her predecessors, but she was also not helpful. The truth, of course, is that Latham's era can be broken into "early Latham" and "late Latham", with these distinguished by when she had Alden/Smith/Scott around and when she didn't. If you compare these periods (roughly delimited by 2006 versus 2007), you find this:

In 2006, Latham and the legacy team achieved a weekly ratings change, on average of +.001...or slight gain. But in 2007, when Latham was solo (i.e., no legacy team) her ratings changed, on average, to a weekly decline of -.006!

Thus, Latham-solo was almost as negative as Alden solo.

Jack Smith's addition did stem the flow, and the rate of decline was much slower...but continuous. Interestingly, overall, Latham's weekly rate of decline was almost identical to Smith's, even though she was brought in to "fix things up". Ironically, a closer examination shows that when she worked with Alden/Smith and other legacy team members, she was actually experiencing slight ratings gain. But, once she let go of the team, her solo rate of decline was actually almost twice as bad as that experienced by Jack Smith.

The optimistic closer, of course, is Maria Arena Bell's current trend, which is actually positive. There has been a slow but steady very slight ratings gain. A little hope for the future....

Monday, December 15, 2008

Ratings: What is meaningful variation?

Soap Opera Network has started an interesting new feature labelled "Daytime's 40 Most Popular Shows" The first week ratings analysis, for the week of 12/01/2008, were posted today.

Writer and site manager Errol says: "The mindset behind the new chart was to compare episodes on a week to week basis, instead of just a weekly average. This is how Cable ratings are compared, not as averages. For instance, Bill O'Reilly's Wednesday episode can rank #1 in the Nielsen's, but it wouldn't if it were averaged for the whole week."

And, indeed, his accompanying ratings analysis makes a point of showing how show rankings can vary across the week. For example:

While NBC's "Days of our Lives" loses 40% of its budget in the upcoming year and a loss of its two stars (Deidre Hall and Drake Hogestyn), three out of its five weekly episodes (Friday, Tuesday, and Monday) outranked every episode of ABC's "All My Children" and "One Life to Live." The highest episode was its Friday broadcast with 2.9 million viewers. For the week, "DAYS" averaged 2.7 million viewers.
So, I'm interested by Errol's basic claim that people are interested in the dailies. I know he is right. SON's weekly ratings thread is among its most active. Every week, posters try to link day-to-day variations in the ratings to stories that were happening, characters that appeared, or particular promotions that were run.

I'm not so sure this sheds much light, for the most part. For example, I took the data Errol charted and plotted in here (click for full-size versions):


Is this meaningful fluctuation, or random variation? For example, there is a general trend for mid-week to be slumpy, and for many shows to start the week stronger than they finish. When you look at it in the millions of viewers (top chart), shows can lose 10% or more of their audience in a given week.

What I am struggling with is whether this is meaningful. I don't really think so. Take Errol's analysis about Days of Our Lives above, for example. Although the ranking may vary over the course of week, I question whether these ranking fluctuations are statistically meaningful. To me, it basically says the shows are neck-in-neck. Do advertisers care about these fluctuations? I suspect they should not.

As I said to Errol, I think a longer-time frame is the appropriate unit of analysis:

Even weeklies, I would argue, are not often meaningful barometers of a show's performance. The most useful number, I would argue, is the SLOPE (unit change over time). Perhaps even more useful is the STANDARDIZED SLOPE (which puts all shows in a common metric before examining their trajectory). That implies the gathering of these ratings over some period of time.
The sole exception, in my opinion, is when the dailies are being used to check on the effectiveness of a particular promotion. I, for example, was glued to the ratings after CBS' heavy promotion of Y&R: Sudden Impact (and, to be fair, a year earlier, Y&R: Out of the Ashes). Sudden Impact got on-network promotion, off-network promotion (E!), and banner ads in lots of places. In addition, the soap press was breathlessly promoting the "big changes" that would come in August. Sure enough, at least in the short term, the dailies responded...Y&R got a bump.


Interestingly, even here I question the value of the dailies. Because the Y&R Sudden Impact bump wore off...and it returned to fluctuating about its regular and lower average.

I have a vague sense that over-focus on the dailies and weeklies may actually be destructive, because it promotes stunt plotting and stunt promotion. (In primetime, the weekly ratings make more sense...because shows have fewer episodes). The barometer of a show's health, I think, is where it is trending.

In that sense, I am actually encouraged by what Barbara Bloom is quoted as saying this week: “It's not just about stopping the erosion. It’s still possible to raise the ratings.”

I am encouraged by the fact that, to me, this suggests Bloom is more focused on trend than snapshot performance. On the other hand, I see no evidence in any quarter that ratings are improvable over the short- or long-haul. I'd love to know what she is thinking, and how she plans to get there, and whether it can work.

Monday, July 7, 2008

What? OLTL is hot, but no ratings bump?

Week to week writing DOES NOT AFFECT THE RATINGS in a meaningful way. Yes, we may see dips and valleys of .1 or .2...but those are trivial. Those are simple random variations around the moving average. This larger trend, of course, is decline and death.

The best analogy I can give is in the muscle strength of an adult from the age of 50 to 100. NO MATTER WHAT THAT PERSON DOES, there will be steady decline and descent in muscle THAT CANNOT BE PREVENTED. Now, there may be week to week fluctuations in strength. "I walked more this week...so I'm a little stronger". That is true! And if the person really works on the muscle, there may even be growth and maintenance. But, in the long haul, the muscle is going to continue to decline and decline and decline. This is called the "inevitability of aging", which is defined as "universal, progressive, deleterious, and irreversible". Hmmmm...that sounds a lot like the ratings trends, doesn't it?

So, how to bring this back on topic? Well, personally, I think the excellence of a Carlivati, and powerful returns like Tina and Marty CAN make a difference...but not in the short run. What you need is a year (actually, they used to say, in the 70s and earlier, five years) of sustained quality to build an audience. I remember John Conboy said that repeatedly about Y&R in the 70s: Five years was the minimum needed for audience building.

Who thinks ABC has five years of patience and five years of budget to let Carlivati work his magic? Who thinks Carlivati has the energy and creativity to sustain five great years? (He may. Many have been complaining that he is reheating the past, rather than creating something new, but he is also trying to honor the 40th anniversary...so he needs some latitude to do this homage AND rebuild the classic base, pace and face of OLTL).

Can you tell it drives me nuts when people expect instant payoffs from stunt casting and the like? WHAT I WOULD EXPECT is (a) a slower rate of decline for OLTL than other shows, and possibly (a gradual 0.2 HH points per year, maybe) increase in the moving average IF ABC/OLTL commits to a five-year plan. (I'm not so sure about the gain, since the whole TV and soap enterprise is in decline...so it is hard to fight the overall contextual trend).

I realize this will never happen. But when we look for meaningful week-by-week variations, we simply are persisting in the face of the fact that these variations are not meaningful.

Saturday, June 21, 2008

I don't think week-to-week fluctuations in soap ratings are meaningful

I just don't think these weekly fluctuations are meaningful. Most shows are up some weeks, down some weeks. This is what is sometimes know as "steady state fluctuation about a moving average".

The weekly fluctuations truly, honestly, deeply, trust me aren't worth worrying about.

Where you get RELIABLE trend data, for example, is if you break the year into quarters....and you compare each quarter to previous quarters. There is a reason that financial analysts look at company balance sheets that way...they know there are random fluctuations, and they are not interpretable.

Take a look at this wiki on random walk. It gets a bit technical, but the core point is this: The TRAJECTORY makes sense, but the bobs up and down on that trajectory are just kind of random and meaningless.

They use a great analogy of a drunkard walking a city street. The drunkard IS getting from point A to point B, but the path is going to weave and bob. If we want to figure out where the drunkard is going, we can't watch that weaving and bobbing...we have to take a longer-view...follow the drunkard for a while to see where he/she is headed.

So, what we have to do with ATWT...with all the soaps...is watch their quarterly averages. Even that COULD be infused with random fluctuation...(even the annual data Sylph and I keep posting shows annual random fluctuation around moving averages)...but it tells a truer story.

One of my fears is that Madison Avenue and the networks watch these weekly variations and try to interpret them...much as we all do. Really, truly, I hope they do not...because they are MEANINGLESS.

In recent weeks, the ONLY trend that I think bears watching is Y&R. Why? because it fell pretty precipitiously from 4.0...and now...in over a month...it has not rebounded. THAT feels like a reliable trajectory to me. But notice that within that REAL plummet, there is a random walk. (Down to 3.4 one week, up to 3.6 the next). That .2 fluctuation is meaningless. What is meaningful is that the show seems to have "permanently" dipped below 4, and it ain't headed back up. (I say that because really there is little evidence in the history of soaps of trajectory reversals...with a very few exceptions...like GH in the early 80s).

Sorry for the lecture, but I can't help myself.....