
 .
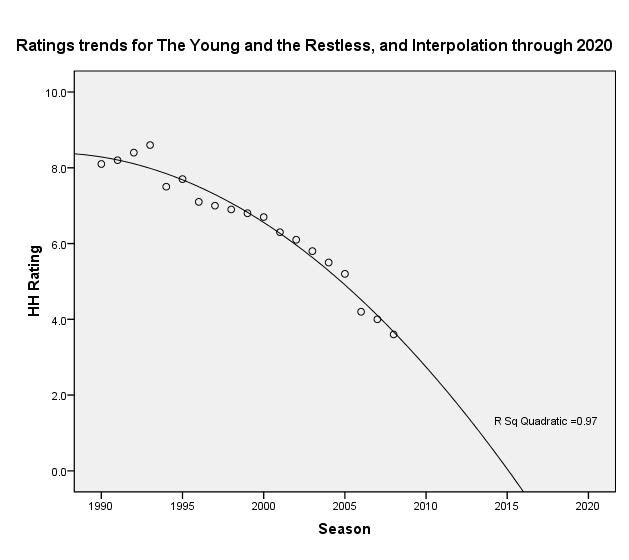
.But look at this one. This is what is called a "quadratic regression". It comes up with the best-fitting line to describe the trajectory of Y&R's ratings since 1990. As you can see, it has a kind of "accelerated decline" function, where more and more people drop each year. (But a linear decline, or straight line, fits almost as well).
I don't need to say another word. The picture literally speaks 1,000 words.

No comments:
Post a Comment