
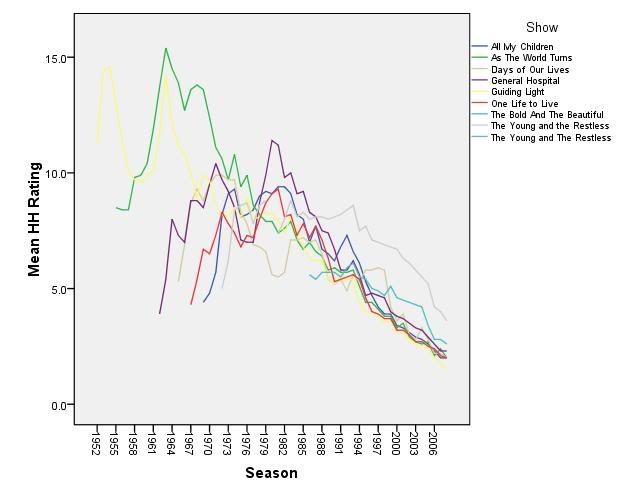
If you ignore the 1950s (where rapid expansion of televisions and television options meant the ratings fluctuated widely, and really aren't so comparable to the "saturated market" ratings we've had since the 1960s and beyond), you see a very clear general trend of growth through the mid-1970s, and then a very clear decline trend ever since. Now, there are some interesting local peaks (GH in the early 1980s; Y&R in the early 1990s), but for the most part all the soaps have moved in lockstep, downward, since the mid-70s.
This is so relentless and universal a trend IT CANNOT BE BLAMED on the creative state of any show or any regime! We really can only blame things like the growth of tv (cable) and non-tv (internet, games) options, the movement of women out of the house, the reduction in intergenerational viewership due to multi-TV households, etc.
The eye does not lie. That is pretty much a STRAIGHT LINE, and it began in the late 70s or early 80s. THERE IS NOTHING SPECIAL about the decline we see today. It is nothing but a "dying off" process (loss of viewers without replacement, at a fairly steady rate) that began almost 3 decades ago.
Oh, if only I could have a nickel every time someone said "the creative state of soaps today is so lousy, and that is why we're losing viewers". Uh uh! The rate of loss is no more significant now than it was 20+ years ago--when some shows were thought to be at Marland-esque, Bell-esque etc. creative heights.
Oh, if only I could have a dime every time someone said "if only TPTB would do such-and-such, ratings would go up." (This probably includes promotion...although I think more promotion might be able to be the one thing that built slight audience growth). Uh uh. NOTHING--not even the blockbuster of Luke and Laura--could stem the trend. If you look at GH in the early 80s, you see that it definitely spiked TEMPORARILY due to that incredible storyline. It clearly brought new viewers into the system. But it COULD NOT LAST (and it didn't), because larger demographic trends were dragging the shows down.
And I want a dollar everytime someone blames OJ Simpson! If you focus your eyes on the early-mid 1990s in the graph above. I defy you to find any significant deviation in HH ratings decline trends! If OJ had not existed, the declines would have been EXACTLY the same. I'll try to show this more clearly below.
The table below tries to show the phenomenon in a different way. Averaging across all shows that were on at any given time, the figure shows the minimum and maximum ratings in each decade. Again, don't trust the 1950s data, because the new technology (TV) and explosive growth of households and viewing options really messes up those numbers
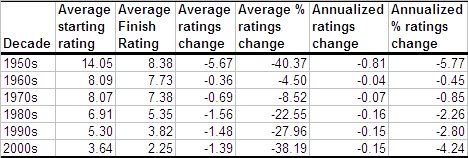
First, focus on second-last column, annualized ratings change. Note that, in every decade, the trajectory has been decline. Second, note that the rate of decline has been EXACTLY THE SAME in the 1980s, 1990s and 2000s. The rate of decline DOUBLED from the 1960s to the 1970s, and it DOUBLED AGAIN in the 1980s. Since then, it has been a fairly CONSTANT loss of 0.15 per year.
From this perspective, it again reminds us THAT NOTHING SPECIAL is happening now. Soaps are not in some "sudden freefall". They are in a constant decline.
On the other hand, the far right column shows us the consequences of this steady viewer loss in the face of a smaller-and-smaller shinking base. This shows us the % of viewers lost annually in each decade. (In other words, of the viewers who started the decade, what percent of those viewers were lost, on average, in each year of that decade?). As you can see, because the number of viewers is smaller and smaller, the steady loss of viewers represents an ever larger proportion each decade.
The current decade evinces about an annual 5% loss...which means (in the 2000s) the steady viewer loss indicated that, of those who started the decade, only about half remained as viewers as we near the end of the decade.
We see this most alarmingly in another post I shared recently, that said GL/ATWT lost about 30% of their viewers in the last year. (Canadian TV Guide further added that GL lost about 21% of its desirable demo during the same period). Those proportions seem apocalyptic...but they are really only that large because of the steady rate of viewer loss over a smaller and smaller viewer base.
Does that mean, for example, that Ellen Wheeler is NOT the anti-Christ? Well, from a long-haul perspective, GL is not visibly declining at an appreciably faster rate than the other soaps. However, if you take a magnifying glass to that "yellow line" representing GL in the graph above, you see that GL was never really above the middle of the ratings pack, and tended to the bottom of the pack twenty years ago. Whoever oversaw THAT relative loss of ranking is much more responsible for where GL is today than Ellen Wheeler. On the other hand, if you peer at 2007-2008 with your magnifying glass, you'll see that the distance between bottom-ranked GL and the next highest soap has widened just a bit. GL has declined just a little faster than the other soaps. (From the beginning to the end of this year, GL lost 30% of its viewers, but Y&R lost about 25%). That doesn't actually seem like an impeachable offense.
Seriously, the overall market trends are driving this. I honestly believe Douglas Marland and Beverley McKinsey could return from the beyond, and GL ratings would still be where they are. The production model could have stayed the same or become more sumptuous, and still the ratings would be where they are. That is because demographic and social forces outside of soaps are causing all of this. In that sense, Wheeler's new production model is a bright strategy! By reducing the cost of producing a soap that would do no better if there were more investment, she at least keeps people employed a little longer.
Sorry for this long-winded post, but there are two final conclusions.
A. Follow the lines, and draw your conclusions. Those of us who love the soap genre MUST prepare to let go SOON. The trend is unmistakeable, universal, continuous, and is based in at least 30 years of history. If we want our soap fix, we'll have to find it online, or in primetime, or in books, or whatever. This TV business model for soaps is utterly unsustainable.
B. We have now reached the point where the ratings are so low, most soaps have needed to implement austerity plans. The cost-cuts are so deep that viewers are noticing (GL's production model, ATWT's minimal sets, ABC's 50% cuts, Days' 40% cuts and firing of its' signature stars).
It may be time to send a different, activist voice to the networks...which is to let our "loved ones" die. We understand that the business is no longer sustainable, and we'd much rather see our shows go out on a strong note, than dwindle into local-access-cable-amateur levels.
Even if active decisions to pull the plug do not happen, our soaps will be gone very-very soon. GL and ATWT are rumored to have 2009 contract extension possibilities (bringing them to 2010), but a September-2009 sayonara for GL is widely rumored. So, too, Days' contract renewal has been much publicized as going to September 2010, and Ken Corday seems very pessimistic about further renewals. It seems to be dependent on certain performance benchmarks that seem (given the figure above) unlikely to occur. If GL/ATWT/Days are all gone by 2010, that leaves us the ABC lineup and Y&R/B&B. With ABC is massive cost cutting (50% cuts and the cancellation of SuperSoapWeekend), these numbers strongly suggest that it hardly seems likely that they can lag much behind in cancellation.
6 comments:
Great post with some really helpful and interesting historical ratings data. May I ask where you got the ratings figures for the earlier years? I ask because I often look for such info myself in my research and have had a hard time finding it! Also, I'm wondering if the graph would change at all if you took into account the number of households a single ratings point stands for at different historical periods. I'm pretty sure it would not change as a result, but was curious as to your thoughts.
The ratings are at two places: Wikipedia (http://en.wikipedia.org/wiki/List_of_US_daytime_soap_opera_ratings) and Soap Opera Network. (So, their accuracy is as good as those shources).
The issue of "ratings" versus "households" or even "viewers" is a good one. The short answer is that I don't have #viewers data consistently, so I am stuck with the household ratings. (I'd love to get those other data). If I had the other data, I would plot them too. My general sense, though, is that the overarching trend is pretty similar.
For example, Soap Opera Network does have #" viewers" data from recent years in their ratings archive. When I have explored limited plots, and compared them to the HH trends, both the rankings of the shows and the time trajectories have been roughly similar.
Still, if you know of better public sources of data, I'd be eternally in your debt if you could point me to them.
Mark
Very interesting post, and it makes a couple of points that I've been trying to emphasize to people for awhile as well. However, I don't agree with the conclusion that the continued decline as you've demonstrated is necessarily natural and unchangeable.
First, I don't think the decline is simply the audience soaps had in the 1960s and early 1970s slowly dying off, although that's part of it. I know a fair number of longtime fans quit watching, rather than watching until they died...
More fundamentally, I'd like to see a comparison of this against primetime ratings. Obviously, it's not an apt direct comparison, since no fictional primetime series have lasted throughout all these decades like these soaps in particular. But I think a comparison could be instructive. Primetime likewise had a decline in ratings that was inevitable once cable, VCRs, the Internet, and other means of consuming media were introduced. However, no one is ringing the death knell for primetime. Is it because there was a decline followed by a bottoming out and stability? If so, what did primetime do differently that daytime didn't?
I've always believed that daytime's mistake was not in losing audience, which was inevitable when women started going into the workforce more substantially and when media consumption choices widened. The networks have had their power usurped in several respects, in that regard. However, it seems anecdotally that primetime has gone through that decline without it being unending. My take is that the reaction daytime had to initial decline was all the wrong things, those which caused people to just continue declining. I think the decline was natural up into the 1990s, because the effects of cable television, the VCR, and so on, were still being felt.
If there is data available to do a comparison of primetime network ratings vis-a-vis daytime's from the mid-1990s until now, it would be an interesting comparison. Perhaps all of television is headed that direction, but I get the feeling that the decline has at least been steeper for daytime, and I wonder if primetime hasn't at least leveled out. If so, why did daytime continue its rate of decline no matter what was being attempted to fix it, while primetime has found more stability? My take is still that the panic in reaction to the initial natural decline has only served to make the initial steep rate of decline continuous instead of temporary.
Great post, Mark, and thanks for putting this all together!
Sam, I am interested in your comment, and I have been thinking about some similar kinds of analyses.
Does anyone know where I could get aggregate (e.g., primetime average) ratings for--especially--the big 3 US networks from the 1950s to the 2000s? If I could get year-by-year ratings, it would be possible for me to DIRECTLY statistically compare the decline slopes in the way that Sam suggests.
Second, I have been seeking some kind of aggregate "newspaper" circulation/readership figures for the same period. Based on a few sources I have perused, it seems to me that their decline slopes are quite similar to those of soaps.
If that is true, it does begin to suggest that there has been an over-arching trend (media change? that's Sam's expertise) that has driven a lot of this.
I'll do a bit of a hunt for the primetime ratings. Elana Levine (who also commented on this blog post) might have some these primetime data too?
Mark--the Brooks and Marsh Complete Directory to Prime Time Network TV Shows has season by season ratings for the top 25 prime time series. The edition I have stops in 1988 but there are likely newer editions available.
In addition to the sources you mention I have also used the soap ratings figures in the Schemering Soap Opera Encyclopedia (but these are still by HH rather than demographics).
I'm so glad that someone statistically minded is crunching these numbers, as it is really helpful data. But, I want to point out a few things--first, that it is debatable whether ratings data is truly representative of viewership, given Nielsen's relatively small sample. Of course, this data is what matters to the industry and thus is crucially important. I'm just saying that we shoudn't trust it too much as holding the truth of who is actually watching what when. Related to this is the time-shifting factor. VCR playback has never been included in the Nielsens (as there was no way to measure it via the meter technology). If we assume that this has been a key way in which many have watched soaps since the '80s then the ratings data is flawed. Also, unless it specifically says so, I don't think that current ratings figures are including DVR playback. Even then, advertisers only seem interested in the "C3" commercial ratings data gathered from DVRs (meaning that, in addition to being included in the Nielsen sample, a viewer would have to play back the DVR'd episode within 3 days and would have to play rather than FF the commercials to have their viewing counted).
All that said, clearly the path of the ratings data over time is significant, and telling. And I'm with you on the OJ explanation--much too pat and not well supported.
Not sure where to find newspaper circulation data. Maybe the Audit Bureau of Circulations?
I am in total agreement with all of Elana's points.
The Neilsen's ARE the best, most representative sample of in-home television viewing. The ratings I used (which are basically the live or live+same day ratings) are clearly only one portion of the total sample of viewers.
I have a post elsewhere in the blog where I argue that when you combine Live + 7 Day, Soapnet, and (legal) online viewership of Y&R, it seems clear that the number of viewers is closer to 8-10 Million a day. Which is not shabby.
Indeed, by some metrics, I suspect Y&R has lost far fewer viewers than the HH ratings curves suggest.
On the other hand, the principal source of support for these shows are the network advertisers, and they clearly are driven mostly by the live numbers, mostly in the 18-39 demographic. So, NO MATTER how accurate the Neilsen numbers are, because they define the economic context in which soaps must survive, they are useful informants regarding viability.
I would love to get my hands on the online viewership statistics...but they are being kept very quiet so far.
Post a Comment