Showing posts with label ratings. Show all posts

Wednesday, March 30, 2011

We'll always have Paris! The Bold and the Beautiful


B&B is on a creative high these days, in part by fully embracing its identity. It plays adults (and senior adults) more than kids. It does bit of socially relevant stuff. It centers on the never ending drama of Brooke Logan and her Ridge. It knows that camp, vague incestuousness, vague perversity, and constant partner switching is its RECIPE...and it's doing it just fine. This week, the luminous Heather Tom's Katie is in the midst of (I think) a re-awakening triangle with ex-lover Nick (who is also the ex-husband of her sister and her niece) and Bill Spencer Jr. (my fave, Don Diamont). Ridge and Brooke--a "destiny/westiny" couple according to her son Rick--had an ultimate over-the-top moment in Paris (see image at top)...and then seconds later Brooke undermined her reunion with husband Ridge by having a flirtatious Skype session with his drop-dead-gorgeous son Thomas. We won't even mention the fact that my favorite, Amber, is in a three-way-who's-the-daddy tale (and I don't think she realizes her baby is going to be African American!). The show is firing on all cylinders.


Why are its ratings not good? Why are its demos so awful? Oh well...even if B&B is not long for the world, we'll always have Paris!


Thursday, February 24, 2011

Daytime on the Bubble: Renew/Cancel Index for Daytime

TVByTheNumbers has accurate "renew/cancel" index for primetime. A show's 18-49 rating is divided by network's average. See http://tvbythenumbers.zap2it.com/the-renew-cancel-index for details.


I computed a renew/cancel for daytime,, dividing each show's 18-49 rating by the average of all 6 soaps. I couldn't really do a network-by-network renew/cancel (like the parent site does) because the pool of soaps is too small. I guess I could use the network daytime average (if I could find equivalent ratings for The View and the Talk, etc)...but I think what I did is already pretty informative.

In the Renew/Cancel index, numbers above 1 (the further above, the better) are "safe", around 1 are "bubble" and below 1 are "likely to be cancelled.

Renew/Cancel Index for Daytime, as of last week:
Y&R 1.43;
DAYS 1.05;
GH 1.05;
OLTL 0.95;
B&B 0.76;
AMC 0.76


Now, what makes this intriguing is the rumor, at Daytime Confidential, that ABC is seriously considering the future of its daypart, and whether to cancel a soap to make room for a talk show.

As once-stalwart (now lapsed) viewer of all ABC soaps, but especially AMC, this would make me sad.

Looking at those numbers, one wonders by B&B isn't similarly on the bubble?

Well, first of all, maybe it is. But, secondly, Les Moonves last year implied that it was one of the "special soaps", and therefore might survive. What could save B&B? Presumably the fact that it is the world's #1 most watched soap, and the international revenue helps the Bell family keep licensing costs extra-low for CBS? With a brand-new high tech opening sequence and a recent two-year renewal, B&B will survive at least as long as Stephanie Forrester (who currently has Stage IV lung cancer).


Wednesday, June 17, 2009

The soap magazines hung on better than the soaps!

Today, I was fiddling around with my usual ratings charts. What started it was the claim by Brenda Dickson (to TVGuide.ca's Nelson Branco) that when she came and left to Y&R, that coincided with Y&R hitting and leaving #1 status. That seems palpably false, since she last left Y&R in 1987 and Y&R didn't hit #1 (where it has stayed) till the 1998-1999 season. This figure illustrates the point.


You can't help but look at those lines after 1990, though, and just click your tongue at the unrelenting bleeding.

So then I got to wondering, "how badly did this all this soap decline hurt the magazines"? The figures and tables below provide some data about this, and they are somewhat surprising. During the 2000s, the magazines have pretty much "held on". Indeed, Soaps in Depth emerged in this decade, and quickly overtook Soap Opera Digest (both the ABC and CBS versions separately overtook SOD in newsstand sales). Some caveats:

A. Data come from the Audit Bureau of Circulations, and only are available free/to the public from 1998 forward (with 1997 data embedded)
B. Public data are limited to the top 100. Soap magazines dropped out of the top 100 in total circulation after 2002, and only Soap Opera Digest appeared in the top 100. So, I don't know about later data.
C. Looking at "single copy sales" (newsstand), the story is less bleak--it actually seems to show relative stability. 3-4 soap magazines appear in the top 100 in every year from 1997-present. Soap Opera Weekly dropped out of the top 100 in 2008 though, so I estimated its average newsstand circulation (at 100,000) for 2008. That may be an over-estimate. (The bleeding circulation for SOW may explain some of the Carolyn Hinsey sacking? Even though it was probably not her fault).

The figures are actually encouraging to me, because it suggests a kind of levelling off of circulation (relative to the shows themselves). From 1997-2000, the single-copy sales include Soap Opera Digest, Soap Opera Weekly, and Soap Opera Update. (In 1997-98, Soap Opera Magazine is also included). After 2000, Soap Opera Update disappears, but is replaced by Soaps in Depth (CBS and ABC) in the newsstand top-100. Interestingly, from 2005 on, Soaps in Depth (both versions) actually EXCEED Soap Opera Digest in newsstand sales.

Since the soap magazines held on better than the soaps themselves, it does make one wonder if viewers who "lapsed" in watching the shows continued to "keep up" by reading the magazines. And if this is the case, is this a good thing or a bad thing? Does the availability of spoilers, recaps and pictures actually hurt the original product?

If anyone is interested, I have the magazine-specific data, and can share it at a later date.

Total circulation of Soap Opera Digest during the years in which it appeared in the Audit Bureau Top 100 Total Circulation


Newsstand circulation of Soap Opera Digest from 1997-2008


Total newsstand circulation of all soap magazines listed in the Audit Bureau top-100, 1997-2008.
(Note, 2008 figure for Soap Opera Weekly is an estimate)

Sunday, May 31, 2009

The Old and the Restless? Who skews older?


On SON's message board today, user CSF (Classicsoapfan) asked about my expression of the legend that B&B skews older than all of the other soaps. So, I decided to look at that using this week's data.

In the table below, I used the data provided by Toups at Soap Opera Network. I took this week's total viewers and subtracted women 18-49, girls 12-17, and men 18+. The "residual" in the second-from-right column is the leftover viewers. While a few boys under 18 and girls under 12 might be included in the residual numbers. These would be negligible. So, the column on the second-from-right mostly represents older women. What it shows us is that B&B is second only to Y&R in absolute number of these (mostly) older women. More importantly, the right-most column shows is the PROPORTION of all viewers that are older. This is a fascinating number, no? It does show in absolute terms, at least last week, that B&B has highest proportion of older viewers. But its' number is only 1% greater than its next neighbors.

The implication is definitely this: If the advertisers truly only value the 18-49 demographic, we can see that CBS has a serious problem...and we have an understanding of why (despite lower numbers) Days remains alive. It is the youngest of ALL the soaps. Why would NBC want to kill that?

One hopes that CBS is able to show the marketing value of reaching such a strong older audience. After all, ads for Depends and Centrum Silver have to run somewhere (just joking)!


SHOWTOTAL18-4912-17MENResidual (mostly women over 49)% of viewers who are older
Y&R4,874,0001,085,00018,0001,104,0002,667,00055%
B&B3,369,000691,00017,000718,0001,943,00058%
OLTL2,560,000848,00027,000411,0001,274,00050%
GH2,550,000905,00049,000386,0001,210,00047%
DAYS2,527,000802,00042,000470,0001,213,00048%
AMC2,518,000793,0008,000461,0001,256,00050%
ATWT2,394,000530,00017,000488,0001,359,00057%
GL1,951,000434,00015,000396,0001,106,00057%


ETA: Carolyn1980 at SON tells me that the 18+ male figure includes men over 50 (of course) which, she says, constitute the MAJORITY of the male soap viewers. Thus, she is saying the proportion of older viewers is even higher than my right column would indicate. You could probably inflate those numbers by a substantial percentage. Wow...that is definitely an aging genre.

ETA2: I added the figure above to help visualize.

Sunday, April 26, 2009

Y&R: "Rating" the headwriters

[Click on the link below to see the full version, if it is trucated]

ETA. SON User Paul Raven was able to give me 1999 ratings, which fleshes out data for Kay Alden. The pattern of data was identical to what I had published in an earlier draft, but it gives me more confidence in the Alden results.

Photobucket

Last week at Daytime Confidential, writer Jamey Giddens wrote an eloquent review of Tom Casiello's first breakdown at Y&R. It was a terrific review, and I agree with almost all of it.

But a funny thing happened in the comment thread. Jamey and a user named Monamis got into a debate about the relative impact of Lynn Latham on the ratings. Monamis points out things really went south with current headwriter (HW) Maria Arena Bell took over, but Jamey Giddens argues that Latham lost a million viewers.

What is the truth? Well, it sounds like a data analysis, and that's my thing.

Here is what I did. I wanted to go back to the start of Kay Alden's regime as solo Headwriter, but Toups' ratings archive at Soap Opera Network only gives me weekly ratings as far back as 2000. Okay, I'd start there.

Because different tenures lasted different periods of time, I thought I should post average weekly changes. These represent the slope coefficients that result when the household (HH) ratings are regressed on week. They represent the single best way to express ratings change in a common metric, despite the varying writing tenures on the show.

The figure at the top illustrates the data graphically. You can see that, as always, there was a lot of week to week variability. So, I am just extracting the linear trends from these data.

I divided the tenures this way:

Alden = Alden solo, before the arrival of Jack Smith
Smith = any period after Smith returned to the show, but before Latham joined
Latham = any period after she was formally named HW, even while Alden and Smith were still there
ArenaBell&Griffith = the disastrous (for ratings) period that began with the WGA writer's strike of 2007, and continued until Griffith's ouster in early 2008
ArenaBell = the post-Griffith period, in which she led a team that included Hogan Sheffer, Scott Hamner, and mahy others.

I further broke Latham's tenure into two pieces. 2006 was when she still had the legacy team (Alden, Smith, Ed Scott and many others) for most of it, and 2007, when she essentially had absolute control over her team without any "legacy" interference.

The table looks like this:


HW regime
Average weekly HH ratings change
Kay Alden
-0.010
Jack Smith with Kay Alden
-0.004
Lynn Latham (overall)
-0.003
Lynn Latham (2006 with legacy team)
+0.001
Lynn Latham (2007 without legacy team)
-0.006
Arena Bell/Griffth
-0.028
Arena Bell
+0.004


What do these numbers show?

It means the worst regime for the show was that Arena Bell/Griffth collaboration, that coincided with the WGA writer's strike and the sudde dismissal of Lynn Latham. Story-wise, the rushed introduction of Sabrina and her whirlwind romance with Victor seems to caused so much disgust that viewers tuned out in droves.

Alden's solo regime was next in problematic ratings. On average, she lost about 0.5 HH ratings points a year, which is a lot.

What that means is that the most disastrous period in the Toups/SON ratings archive is the several month period in which Arena Bell was writing with Josh Griffith. During this period, which encompassed the writer's strike and brief period thereafter, there were non-trivial declines on a week-by-week basis. "Bleeding". Many internet bloggers/message boarders blame this on the "damaged ground" that these writers inherited from Latham, but the descent was so precipitous, I have to believe that the introduction the much-younger Sabrina and Victor's whirlwind romance with her provoked a "disgust" response that led to massive tuneout.

More impressive is that in the time since Griffith left, Arena has actually stemmed the bleeding, and she is the only HW since Bill Bell to show ratings GROWTH.Now the growth is actually fairly anemic (.004 HH ratings points per week, on average), but in this climate, any growth is breath-taking.

Ratings-wise, the second-most difficult period in the post-Bell era was Kay Alden's solo regime, at least in the period beginning with 2000. Every ten weeks, on average, the show could be expected to lose 0.1 ratings points, or about 0.5 ratings points a year.

It seems that Alden's collaboration with Smith stemmed the tide...during this period, a much slower rate of decline set in.

And here is where it gets interesting. Latham was brough into shake things up. But, overall, her weekly rate of ratings decline (-.003) was only trivially different from the Smith & Alden era. She was not any more destructive to the ratings than her predecessors, but she was also not helpful. The truth, of course, is that Latham's era can be broken into "early Latham" and "late Latham", with these distinguished by when she had Alden/Smith/Scott around and when she didn't. If you compare these periods (roughly delimited by 2006 versus 2007), you find this:

In 2006, Latham and the legacy team achieved a weekly ratings change, on average of +.001...or slight gain. But in 2007, when Latham was solo (i.e., no legacy team) her ratings changed, on average, to a weekly decline of -.006!

Thus, Latham-solo was almost as negative as Alden solo.

Jack Smith's addition did stem the flow, and the rate of decline was much slower...but continuous. Interestingly, overall, Latham's weekly rate of decline was almost identical to Smith's, even though she was brought in to "fix things up". Ironically, a closer examination shows that when she worked with Alden/Smith and other legacy team members, she was actually experiencing slight ratings gain. But, once she let go of the team, her solo rate of decline was actually almost twice as bad as that experienced by Jack Smith.

The optimistic closer, of course, is Maria Arena Bell's current trend, which is actually positive. There has been a slow but steady very slight ratings gain. A little hope for the future....

Sunday, April 19, 2009

Daytime and primetime ratings: Pas de deux?

A user over at SON asked “how tied have the fortunes of daytime and primetime been?” Is there any truth that as primetime declined on a network, so did daytime? The answer seems to be “yes, the fortunes of daytime and primetime have been tied together”. But it is somewhat more complex, because the ratings have shown stronger and weaker associations, depending on the network and decade. Data sources for primetime ratings are, and for daytime ratings are contained in the two threads linked below. Thanks are due to SON users dmarex, ReddFoxx, AllMyShadows and Sean, who helped me figure out which soaps aired on which networks.

I once previously examined primetime/daytime ratings overlap, but this is different. This analysis is more accurate, in some ways, than the overlapping slopes I presented before, for two reasons. First, this analysis breaks it down by network, and second, by now having coupled ratings for daytime and primetime in each season, we could more accurately examine actual year-by-year correlations.


We examined the association between primetime and daytime ratings (aggregate, averaged over all shows) for all networks from 1965 to 2009. I eliminated seasons before 1965 because, particularly for ABC, there was enormous initial variability as the networks grew.

What you see below is an analysis of variance table. The upshot of it is “the story is complicated”. The association between daytime and primetime ratings varied by network and by decade. But, look at that “R-squared” value, which says how much of the variance in daytime ratings we explained with this model: 94%. The legend, for the statistically minded: Dependent variable is Daytime Rating (D_Rat). Independent variables are Network, Decade, and Primetime Rating (P_Rat), and all possible interactions. (Click on the figure to see the full version, if it is truncated)

Photobucket

So, next, I examined the daytime/primetime associations separately by decade and network. The results look like this: (Click on the figure to see the full version, if it is truncated)

Photobucket

Now this is initially confusing, because it shows that the trends really varied by decade and network. “Green” means they changed together; “Red” means they did not or that primetime and daytime actually moved in opposite directions. The best way to visualize this is to look at the ratings, year-by-year, for daytime and primetime together. The next graphs show these: (Click on the figure to see the full version, if it is truncated)

Photobucket

Let’s note, overall, that a story I have told before – that soap ratings really began to decline almost from the beginning – is palpably obvious. ABC soaps grew through the early 70s, rebounded again with Gloria Monty’s GH, and then have declined ever after. In the 70s, ABC’s primetime lineup was growing at a faster rate than daytime…which was struggling with up-and-down. Just as ABC primetime was reaching heights (with Charlie’s Angels and Happy Days) its soaps were in descent. But then, beginning in the 1980s, ABC’s daytime and primetime lineups were yoked, falling in tandem. That association has broken a bit in the 2000s, as ABC primetime has experienced some upticks (Lost, Desperate Housewives, Dancing with the Stars) while the daypart has been on a linear decline trajectory.

For CBS, the story is quite similar. Remarkably, as you can see, the soap ratings were in decline through almost the entire period. That’s as close to a straight-line decline, for CBS daytime, as you’ll ever find. “OJ killed the soaps”. BALDERDASH. That slope of decline is remarkably constant since 1965, and don’t let anyone tell you otherwise. In contrast, CBS primetime was moving in almost the opposite direction all through the 1980s, as Carol Burnett and Mary Tyler Moore and Archie Bunker and their network compatriots created a grand era of gain and maintenance… There was a late 80s fall, then a massive early 90s rescue, then freefall in the early 1990s from which CBS primetime has never recovered. Thus, from about 1993, daytime and primetime fell together. But again, by the 2000s, as with ABC, we see a separation of trajectories. Primetime has managed relative stability (CSI anyone?), while daytime has been in linear decline.

Except in the 1970s, for NBC, daytime and primetime have been a pas de deux. NBC daytime has been in decline, steadily, since the early 1970s. So has primetime, except for slow growth and decline in the 1970s that was followed by the mid-80s revolution that Cosby, Family Ties, and Cheers achieved, along with the early-mid 90s rebound that ER brought.

Looking at both the graphs, and the table above, we see that daytime and primetime had yoked trajectories, more or less, in eight out of 15 “decade-by-network” cells. Moreover, the overlapping trajectories were greatest in the 1980s and 1990s, as larger forces of global, systemic decline drove both sets of ratings down. This association has actually been weakened a bit in the 2000s as, for two networks, the rate of decline for daytime has been somewhat steeper than primetime (for ABC and CBS).

This last fact is, in my opinion, somewhat ominous for daytime. Although viewers are being lost all over the dial, if primetime is has declined at a slightly lower rate, it would seem to suggest extra vulnerability for the soaps. Indeed, I think that may be part of the reason CBS lost patience with Guiding Light.

Ratings in context: Soaps near bottom, but slower decline

Roger Newcomb recently linked an article reporting the recent March Sweeps ratings performance (both household rating, and one-year or season-to-date trends) of syndicated daytime and early prime shows. I decided to ask the question of "where do soaps fit in?". I had two questions. First, compared to other genres, how does the average ratings of soaps compare? Second, how does the one-year change rate compare? The answers follow in detail, but in summary, soaps really aren't doing very well in the overall daytime landscape, but their bleeding seems to have slowed. Other genres (judge shows, sitcoms) declined faster in the past year, but because they are cheaper and pull better numbers (sitcoms, anyway), I imagine they might still be more viable.


These answers were a little surprising to me, because I don't pay much attention to other genres. As a caveat, I am showing brute averages, and it would probably be more correct to do weighted averages that adjust for numbers of viewers, etc. In addition, these focus on household ratings numbers (which is all I could get, for the most part)--when we're constantly told it is that 18-49 or 18-34 demo we care more about.

Sitcoms: HH = 3.3
1st Hour morning news (e.g., Today): HH = 3.2
Game Shows: HH = 3.2
Entertainment news (e.g., ET): HH = 2.6
Soaps: HH = 2.2
Talk shows: HH = 2.1
Judge shows: HH = 1.6


That's pretty striking. In terms of delivering eyeballs, the relatively expensive soaps are in the bottom half of daily stripped programming! Yikes! If you were a bean counter, what genre would you pick to deliver eyeballs? Probably not a long-running drama that skews old in the demographics.


Now, the one-year decline trends tell a slightly different story...but this is again a bit of a problematic analysis (because it mixes new programs with long-running shows, and it doesn't control for things like affiliate clearance rates and the like). Still, I think several interesting stories emerge from these numbers:


Sitcoms: -13%
Game Shows: -7%
Entertainment news (e.g., ET): -3%
Soaps: 0%
Talk shows: +3%
Judge shows: -13%

First, in the short term, the soaps seem to have bottomed out, something Sara Bibel has also recently wondered. While we have still seen declines in many shows (B&B, GH, ATWT, GL), these have been offset by minimal decline and gain for others (Y&R, DOOL, AMC, OLTL).

Second, the highest decline rates seem to be for judge shows and sitcoms...but both of these are so relatively cheap. The judge shows, both at the bottom of the ratings pack and with the steepest descent, would seem to be at greatest risk...but they cost so little. The sitcom decline is more interesting to me, since the era of the "grand hit" (Friends, Cosby, Seinfeld) is over, and so I don't know if that genre can flourish without another big primetime hit. On the other hand, since there are no incremental production costs for repurposing and stripping primetime shows, I think all it means is that affiliates will be able to license syndicated shows at a lower rate.

Third, there is enormous variability within genres. That talk genre has some shows that show big to huge gains (Oprah, Ellen, The Doctors, Steve Wilkos, Bonnie Hunt), and these all suggest the talk genre still has momentum. On the other hand, no sitcom, judge show, or game show showed gain...and that suggests that some of those genres may be even more stale than soaps. Still, because those other genres are cheap, I'd still predict they have a better shot of persisting than soaps. The celebrity fascination is still viable, with several gossip/entertainment news shows showing growth.Maybe Soapnet is right to bet on more celebrity-oriented fare? It is somewhat surprising that 'reality' has still not found a foothold on daytime.


Wheel of Fortunea

7.2

-8%

Jeopardy

5.8

-6%

Oprah

5.4

+10%

Two and a Half Men

4.8

-8%

Judge Judy

4.4

-6%

Entertainment Tonight

4.3

-2%

Today Show (1st hour)b

4.2


Family Guy4.0-13%
The Young and
the
Restlessc

3.7

-1%

Seinfeld

3.6

-12%

The Viewd

3.5


Dr Phil

3.5

-17%

Good Morning America (1st hour)

3.4


Everybody Loves Raymond

3.1

-16%

The Price is Righte3.0


Inside Edition

3.0

-6%

George Lopez

2.8

-13%

King of Queens

2.8

-7%

King of the Hill

2.7

-17%

Live with Regis & Kelly

2.6

-4%

Friends2.5-14%
Today (2nd hour)

2.5


The Bold and
the
Beautiful

2.5

-9%

Who Wants to Be a Millionaire

2.4

-14%

Ellen Degeneres

2.3

+10%

TMZ

2.3

+5%

Judge Joe Brown

2.2

-12%

Access Hollywood2.2-4%
Days of
Our Lives

2.2

+2%

CBS Early Show (1st hour)

2.1


All My
Children

2.0

+12%

One Life
to Live

2.0+11%
General Hospital

2.0-7%
The Doctors

1.9

+46%

People's Court1.9-17%
As The World
Turns

1.9

-7%

Rachel Ray

1.8

-5%

Maury

1.8

-5%

Extra

1.8

+6%

Insider

1.8

-14%

Deal or No Deal

1.7

+6%

Judge Mathis1.6-20%
Guiding Light

1.6

-4%

Judge Alex

1.5

-12%

Family Feud

1.5

-21%

Today (3rd hour)

1.4


Divorce Court

1.4

-18%

Tyra

1.1

0%

Cristina's Court

1.1

-8%

Jerry Springer

1.1

-8%

Steve Wilkos

1.1

+22%

Bonnie Hunt

1.0

+25%

Judge Karen

0.9

-18%

Morning Show with Mike and Juliet0.9-10%
Judge David Young0.80%
Martha Stewart0.7-30%
Trivial Pursuit0.60%
Family Court0.5-17%


a Ratings and change data taken from http://www.broadcastingcable.com/article/196222-Syndication_Ratings_Doctors_Ahead_of_the_Pack_in_Rookie_Field_During_Sweeps.php; where the show had been on for less than a year, ratings reflected change since premier

b Morning show ratings taken from http://nbcumv.com/release_detail.nbc/news-20090409000000-big039today039.html One year change data were not readily available.

c Soap opera season to date ratings taken from Soap Opera Network, http://boards.soapoperanetwork.com/index.php?s=&showtopic=30056&view=findpost&p=704665. One year change rates computed from one-year change in total viewers as reported at SON

d The View ratings taken from ABC daytime press release http://tvbythenumbers.com/2009/04/09/sweeps-ratings-for-abc-daytime-programming/16404, total viewers = 4,100,000. HH rating estimated by linear regression (Rating = viewers), using data from Soap Opera Network (see footnote c above). The conversion formula was Rating = .096 + 7.081E-7*Viewers. One year change data were not readily available.

e. The Price is Right ratings were averaged over Part 1 and
Part 2(first and second half hour), and reflect season-to-date as reported in January at http://www.medialifemagazine.com/artman2/publish/Dayparts_update_51/Price_is_Right_falls_off_with_new_host.asp, total viewers = 4,800,000. HH rating estimated by linear regression (Rating = viewers), using data from Soap Opera Network (see footnote c above). The conversion formula was Rating = .096 + 7.081E-7*Viewers. One year change data were not readily available.


Sunday, April 5, 2009

Patrick Erwin's Domino hypothesis: Wacky?

Patrick blogged on his website today, reacting to a TVWeek columnist who apparently felt that Patrick's "domino thesis", expressed thusly

”Understand that if GL is canceled, it will start a domino effect. If/when GL and/or DAYS disappears, you can expect other shows to follow quickly in their footsteps.”

was "wacky".

Since I'm all about understanding causal factors and modeling them, this domino hypothesis (what some statisticians would call a Markov chain) is very intriguing to me? In the end, I do not believe that the proposition that the fall of GL will contribute to the fall of other soaps is a testable one. Intuitively, I think he has a point, though.

============

1. Per se, the cancellation of Guiding Light will have no necessary effect on any other soap. Just like canceling, say Jericho, had no effect for CBS on Criminal Minds or CSI:Everywhere, I don't think that cancelling GL will necessarily impact any other show.

============

2. Will cancellation lead to more or less promotion for other soaps? It really doesn't matter. The loss of GL, in principle, costs a promotion venue for other soaps, pitched at soap watchers. But the reality is that a daytime replacement (say Pyramid) could have soap promotions, and they might actually be more effective, because they might court new non-soap viewers. Moreover, with one recent exception (CBS' promotion of Y&R's Sudden Impact arc), there is no evidence AT ALL that promotion influences short-term ratings. In October 2007, for example, CBS bought ad time on other networks to promote its Y&R Out of the Ashes arc...and ratings actually went down.

============

3. It is the "taint of death" that may kill them all. I think there is much greater risk to the genre in further heightening the widespread understanding that daytime is a dying genre. Phil Rosenthal writes in today's Chicago Tribune that

The laws of physics don't change: Mass times acceleration still equals force. But with audiences splintering across an ever-widening spectrum of content, individual mass media outlets simply don't have as much mass as they used to, leaving acceleration to pick up the slack—and it's the speed with which word of that content travels rather than the content itself that creates the impact...."Light" has its own devoutly faithful followers, to be sure, although that number has declined. When it comes to daytime drama, people are far more likely to be talking about the latest blowup on ABC's "The View" which averages 4.25 million viewers.
Translation: "buzz" matters. And the cancellation of Guiding Light, he would argue, is in part because it was no longer buzzworthy. (That's wrong, by the way. Proof: Otalia).

But, in support of Patrick's thesis, the cancellation of Guiding Light produces a followup negative buzz. If "Grandma's soap" or "the oldest soap" or "the only soap to survive radio" dies, it doesn't take much for some cultural consumers to further understand that soaps are a dying genre. And that WILL influence their likelihood of sampling other soaps.

Case in point: "Disco Sucks":

Only by killing disco could rock affirm its threatened masculinity and restore the holy dyad of cold brew and undemanding sex partners. Disco bashing became a major preoccupation in 1977. At the moment when Saturday Night Fever and Studio 54 achieved zeitgeist status, rock rediscovered a rage it had been lacking since the '60s, but this time the enemy was a culture with "plastic" and "mindless" (read effeminate) musical tastes. Examined in light of the ensuing political backlash, it's clear that the slogan of this movement--"Disco Sucks!"--was the first cry of the angry white male. -- Peter Braunstein

The 'Disco Sucks' campaign was a white, macho reaction against gay liberation and black pride more than a musical reaction against drum machines. In England, in the same year as the 'Disco Sucks' demo in America, The Young Nationalist - a British National Party publication - told its readers: 'Disco and its melting pot pseudo-philosophy must be fought or Britain's streets will be full of black-worshipping soul boys.'...Then WLUP-DJ Steve Dahl is credited by many with singlehandedly ending the disco era. On July 12, 1979, after several smaller anti-disco events, Dahl's "Disco Demolition" between games of a twi-night doubleheader at old Comiskey park, ended up with the field completely trashed, and the White Sox forced to forfeit the second game.
It is this reinforcement of soaps as a dying genre ... in the minds of ad executives, network leaders, and cultural consumers that could, in effect, be a Donna-Summer-style-soap-killer.

============

4. But here's the thing: Soaps are dying. Short of holding on to GL as some kind of public/historical service, soaps are dying. My recent post with some new prediction models kind of illustrates that inescapable conclusion, I think (albeit, with a little hope thrown in).

In that sense, I really think it is important not to over-inflate the significance of the GL cancel.

Really, truly, rationally, we knew this was coming. Some of us thought it might wait till 2010, but Ellen Wheeler talked candidly about this with the GL bloggers late last year.

Moreover, as that figure above shows, most of us kind of know the pecking order of impending cancellations, and that hasn't changed since GL's cancellation. It is "foreordained" by the numbers and the trends...and the sad fact that for most of the population soaps are now as hopelessly out of date as disco and Lawrence Welk and manual typewriters.

Cultural obsolesence, coupled with changing daytime demographics and changing advertiser economics is what did this.

============

5. Whither soap opera? Maybe that is more correctly asked as "what is the future of the serial?"

The future is not in the daytime. The future is not melodramatic. The future is not necessarily woman-oriented. The future is not daily. The future is not on broadcast TV.

The evolution is being televised.

Friday Night Lights. ER. Brothers and Sisters. Lost. True Blood. Continuing themes in NCIS. The serial is really alive and well. Adult drama is live and well (well, thanks to Jay Leno on NBC...maybe not so well right now).

The soap -- a particular commercial form for women to "listen" to at home while ironing and cooking -- that is on the way out. For those of us who loved it, that is lamentable...but we can take comfort in all the contributions soaps have made for most of the 20th century and a smidgen of the 21st.

============

6. Wacky? Not at all. Not one bit. But the use of that word "wacky" is a fundamental one--and it displays the kind of cultural bias that soaps have had to work against from the beginning.

  • Too commercial (e.g., James Thurber's "Anacinville")
  • Too women-oriented (melodrama produces eye rolls in the network executive)
  • Too emotional and relationship oriented (that's basically misogyny and, in more recent times, homophobia)
  • Too old (When we call them "grandma's stories", we're basically buying into both ageism, and the prevailing belief that generations can't share popular culture)

Wacky is just the latest line of insults that soaps and their supporters have had to endure. So, as we have for the better part of a century, our best course of action is to ignore the insulters. Because they do not understand how these "worlds without end" have given us a sense of home and narrative throughline that runs through our lives. They cannot know what we will be missing, because they never had the joy of experiencing it for themselves in the first place.

Saturday, April 4, 2009

Optimism/Another Graph/GL's fate is not Ellen Wheeler's fault

A persistent irritant for me is the claim that the fate of GL (and all soaps) is due to "bad writing" and mismanagement. Ellen Wheeler is heralded as the anti-Christ. If not she, then Paul Rauch, John Conboy, Ellen Weston, Jill Farren Phelps, Mary Alice Dwyer Dobbin and a whole cast of villains gets blamed for what happened.

I have tried to prove here, elsewhere that:

- the rate of decline is virtually identical for all the soaps; excluding small variations (where soaps jockey for different positions in the rank order) they've all gone down in lockstep
- no 'resurgence' (not even GH's celebrated early 80s triumph) has had any long-term impact on the decline process that started in the 1970s or earlier (and became clearly manifest by 1980)
- indeed, in the last decade, the rate of decline in daytime has mirrored that of primetime, suggesting that the problem may be more related to "broadcast TV" than soaps in particular.

I've been called naive, immature and misguided for this. I still think I am right :). When the same thing happens to every show, you have to believe it is something about the industry or the genre or the platform.

What I believe is that the creative state of soap CAN influence its relative position. For example, I think the reason Y&R has been consistently #1 for almost two decades relates, in part, to its use of a consistent cast, production style, narrative throughline from the beginning. "Jill and Kay", two presently front burner characters, were both on the front burner in 1973. I also think CBS and her affiliates have been more supportive of Y&R, scheduling the show during a higher-viewership time (lunchtime, for many), and not punting the show all over the daypart.

But, even Y&R has declined, more or less, at the same rate as all the other shows. Which tells me, as someone who thinks a lot about "systems level processes" in my day job, that this is more about factors extrinsic to soaps.

In the past, therefore, I (erroneously?) concluded that all soaps are going to follow this death trajectory. By using some simplified projections (a linear rate of decline that is constant for all soaps) I went so far as to say the last soap, Y&R, might be cancelled in 2016.

Now, I think I might be wrong. At the behest of several posters at SON, I redid the above analysis, making a few changes: First, I did not require linear decline (that is important, because it means that if any show seems to be "levelling off" in decline, this new model will pick that up). Second, I did not impose the same decline slope for all shows -- I let the actual data from the past decade, for each show, determine the decline slope. Using that, and picking an arbitrary cancellation criterion of Household Neilsen Rating = 1.5 (which I picked out of thin air), some interesting things happened.
  • First, I replicated some of my previous findings: It would appear that ATWT, DOOL, AMC and OLTL are all on a pretty unstoppable "death" trajectory (but only if my assumptions are right!).
  • Second, three soaps (GH, Y&R, B&B) would seem to have the possibility of levelling off. Which means, if you project into the reasonable future (e.g., 2013), there is no reason to project (on strictly quantitative groups) that they will reach the cancellation threshold.


Is the rate of decline REALLY levelling off? Well, I plotted the four-year HH ratings (which I realize many don't care about, because it's all about the 18-49 female demo, but I care more about how many absolute Live+Same Day viewers a show gets), and sure enough, the slope of descent has apparently slowed from higher rates earlier in the decade.


"A little hope, a little romance, a big fat bulge in the hero's pants" (from Soaps in the Bunker).

Monday, December 15, 2008

Ratings: What is meaningful variation?

Soap Opera Network has started an interesting new feature labelled "Daytime's 40 Most Popular Shows" The first week ratings analysis, for the week of 12/01/2008, were posted today.

Writer and site manager Errol says: "The mindset behind the new chart was to compare episodes on a week to week basis, instead of just a weekly average. This is how Cable ratings are compared, not as averages. For instance, Bill O'Reilly's Wednesday episode can rank #1 in the Nielsen's, but it wouldn't if it were averaged for the whole week."

And, indeed, his accompanying ratings analysis makes a point of showing how show rankings can vary across the week. For example:

While NBC's "Days of our Lives" loses 40% of its budget in the upcoming year and a loss of its two stars (Deidre Hall and Drake Hogestyn), three out of its five weekly episodes (Friday, Tuesday, and Monday) outranked every episode of ABC's "All My Children" and "One Life to Live." The highest episode was its Friday broadcast with 2.9 million viewers. For the week, "DAYS" averaged 2.7 million viewers.
So, I'm interested by Errol's basic claim that people are interested in the dailies. I know he is right. SON's weekly ratings thread is among its most active. Every week, posters try to link day-to-day variations in the ratings to stories that were happening, characters that appeared, or particular promotions that were run.

I'm not so sure this sheds much light, for the most part. For example, I took the data Errol charted and plotted in here (click for full-size versions):


Is this meaningful fluctuation, or random variation? For example, there is a general trend for mid-week to be slumpy, and for many shows to start the week stronger than they finish. When you look at it in the millions of viewers (top chart), shows can lose 10% or more of their audience in a given week.

What I am struggling with is whether this is meaningful. I don't really think so. Take Errol's analysis about Days of Our Lives above, for example. Although the ranking may vary over the course of week, I question whether these ranking fluctuations are statistically meaningful. To me, it basically says the shows are neck-in-neck. Do advertisers care about these fluctuations? I suspect they should not.

As I said to Errol, I think a longer-time frame is the appropriate unit of analysis:

Even weeklies, I would argue, are not often meaningful barometers of a show's performance. The most useful number, I would argue, is the SLOPE (unit change over time). Perhaps even more useful is the STANDARDIZED SLOPE (which puts all shows in a common metric before examining their trajectory). That implies the gathering of these ratings over some period of time.
The sole exception, in my opinion, is when the dailies are being used to check on the effectiveness of a particular promotion. I, for example, was glued to the ratings after CBS' heavy promotion of Y&R: Sudden Impact (and, to be fair, a year earlier, Y&R: Out of the Ashes). Sudden Impact got on-network promotion, off-network promotion (E!), and banner ads in lots of places. In addition, the soap press was breathlessly promoting the "big changes" that would come in August. Sure enough, at least in the short term, the dailies responded...Y&R got a bump.


Interestingly, even here I question the value of the dailies. Because the Y&R Sudden Impact bump wore off...and it returned to fluctuating about its regular and lower average.

I have a vague sense that over-focus on the dailies and weeklies may actually be destructive, because it promotes stunt plotting and stunt promotion. (In primetime, the weekly ratings make more sense...because shows have fewer episodes). The barometer of a show's health, I think, is where it is trending.

In that sense, I am actually encouraged by what Barbara Bloom is quoted as saying this week: “It's not just about stopping the erosion. It’s still possible to raise the ratings.”

I am encouraged by the fact that, to me, this suggests Bloom is more focused on trend than snapshot performance. On the other hand, I see no evidence in any quarter that ratings are improvable over the short- or long-haul. I'd love to know what she is thinking, and how she plans to get there, and whether it can work.

Monday, December 8, 2008

What J. Bernard Jones Started (Part I)

(Part 2 is here; Part 3 is here).

Daytime Confidential's J. Bernard Jones has written the kind of detailed, analytic, insightful, contrarian essay about daytime's survival that simply begs rereading and rereading.

The crux of this post is this picture. It puts daytime and primetime US network ratings on a common scale, and then compares them for the past 50+ years. As you can see, a key point of J. Bernard's is absolutely correct: We must not over-focus on daytime ratings decline. The daytime decline is clearly part of a much larger phenomenon. In this picture, daytime (green) and primetime (blue) have been in a completely overlapping death spiral since at least the 1980s! I'll return to this picture again below.


I don't do Mr. Jones justice by paraphrasing him, but that won't stop me. Basically, he challenges all of us nattering nabobs of negativism who keep proclaiming the imminent end of daytime soaps. Beyond wondering if we're guided by a kind of Schadenfreude (putting it "out there in the universe" to make it true), he suggests that an exclusive focus on daytime ratings ignores the broader context of what is happening to the networks in general. He reminds us that the whole enterprise of network TV is doing badly, so daytime may be doing relatively okay. Moreover, daytime delivers a reliable (if shrinking) niche demographic that no alternative format can deliver. Every attempt to replace soaps, he points out, has yielded an even less successful alternative. Finally, he suggests that retreat only exacerbates the decline of daytime. NBC is in the trouble it is in, he suggests, because it has systematically turned its back and squandered its audience.

His is an essay of such richness and complexity, it really demands careful consideration. I would like to do that over the next 3 blog posts.

In Part 1 (this part), I'm going to examine his thesis that daytime is not the only thing falling. I've been struggling to get a bigger handle on just how much things ARE falling everwhere in the old, advertiser supported media.

In Part 2, I want to consider WHY people (including me) are so intent on proclaiming that "the sky is falling". It is an ardent "death pool" out there on the internet boards (and in the mainstream media, as J. Bernard proclaims). But why? What function does it serve?

In Part 3, I hope to address why -- as much as I love his blog entry-- I think J. Bernard is wrong. The sky IS falling. Daytime is just about done. At the same time, I agree with him...this is just the selection pressure that will give rise to the evolution.

=========

Part 1. On the ubiquity of the decline.

It really is quite striking. J. Bernard is right. Daytime ratings are not the only things falling.

TVBythenumbers has this useful set of data and illustrations:


So it is clear: The audience for TV is actually growing...but it is also GOING: to cable.

Going further back, you'll see something familiar: The same "inverted U" that we see for daytime. US network ratings have been in freefall for a very long time.


Now, since I have the EXACT same data period for soaps, I really want to find a way to compare the two set of ratings. In order to do this, what I need to do is figure out how to put the ratings for daytime into the same "metric" (range of values) as these primetime figures.

To accomplish that, I used a process called 'standardization'. I can explain this more for those who want it, but for now, suffice it to say that I took the daytime average and the primetime average, and (a) I averaged across all daytime shows, (b) I I averaged across all primetime networks, and (c) I converted them into something called T-scores (scores that have an average of 50 and a standard deviation of 10). I return now to the figure I posted at the top of this blog entry, which shows you what happens.


It appears J. Bernard has a point! Look at the period since the early 1990s. The slope of the decline is IDENTICAL for primetime (blue) and daytime (green)!

Juxtaposing the two sets of numbers adds another fascinating insight. Daytime (green) was on the leading edge of the decline, showing clear evidence of decline for the last 3-4 decades. Primetime (blue), in contrast, was continuing to build through the late 70s. But then, when decline set in...the trajectory quickly emulated that of daytime. The amazing lockstep decline of the two figures is...breathtaking!

So, yes, daytime is not alone. In my words: "The sky is falling, but not just over the daypart".

I'll close this post by noting that a lot of old media are going through virtually identical trajectories. It is not just daytime, and that is worth noting. The underlying sociological phenomenon is one we really need to understand better. The figure above from TVBytheNumbers suggests we can understand much of the network decline as "loss to cable". But a similar fractionation and movement to new media seems to be causing a ubiquitous loss to traditional methods of dissemination.

There are newspapers:


There is the recording industry:


Even Wimbledon viewership follows the trend:


So, when your friends tell you "Soaps are sinking because the quality sucks", can you PLEASE tell them it's more complicated than that! J. Bernard told us so, and he is right.

Sunday, December 7, 2008

A picture speaks 1,000 words

Okay, I know my damn graphs get irritating, even to me smile.gif.

But look at this one. This is what is called a "quadratic regression". It comes up with the best-fitting line to describe the trajectory of Y&R's ratings since 1990. As you can see, it has a kind of "accelerated decline" function, where more and more people drop each year. (But a linear decline, or straight line, fits almost as well).

I don't need to say another word. The picture literally speaks 1,000 words.

Sunday, November 30, 2008

Another ratings reality check (or don't blame Ellen Wheeler)

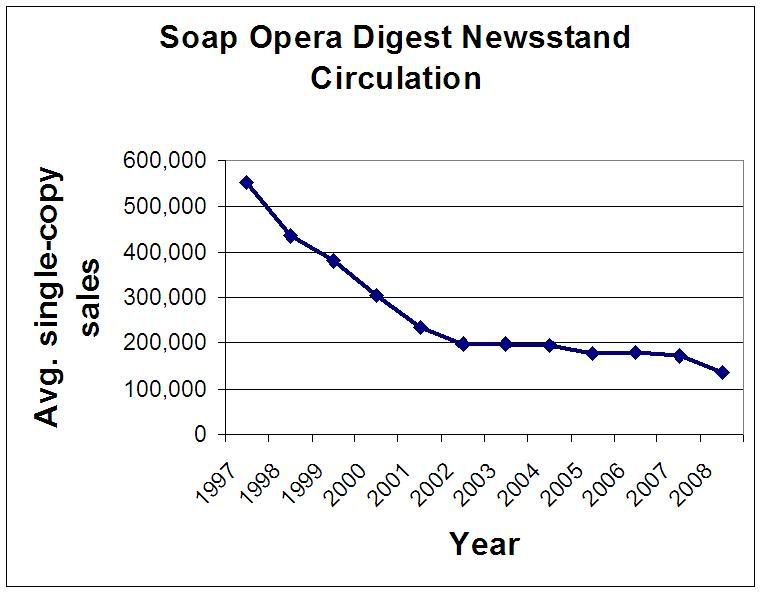
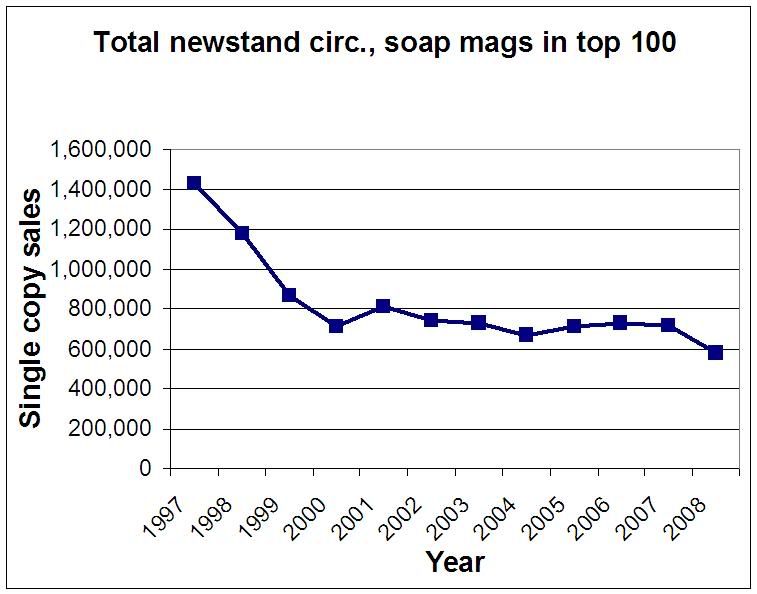
Here, in the past, I have put up 
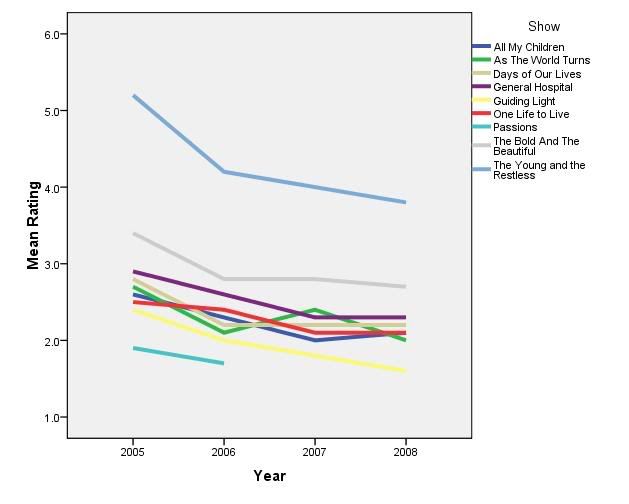
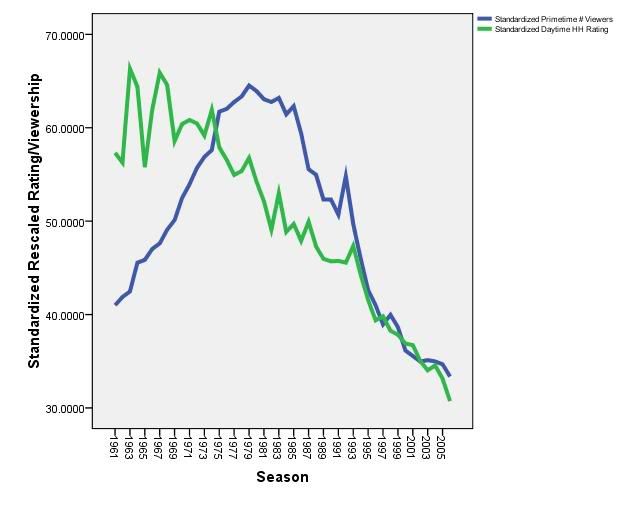
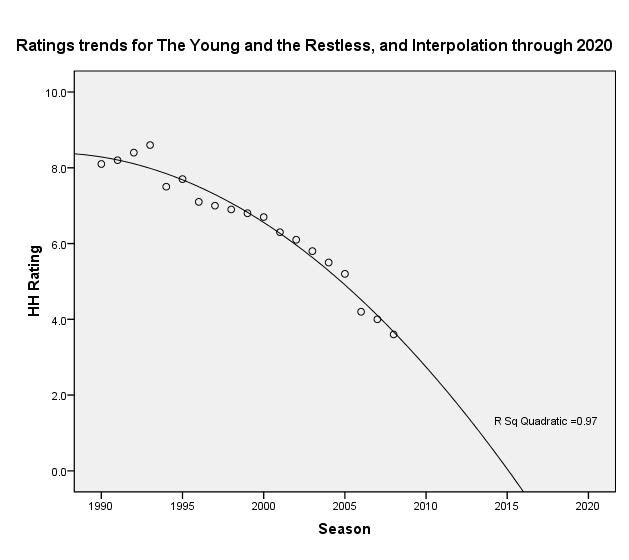
ratings graphs that show the ratings (household, per Neilsen) for our soaps in historical context. I updated the graph with season-to-date ratings. Showing only currently-living soaps, here are the ratings trends as of 11/2008:


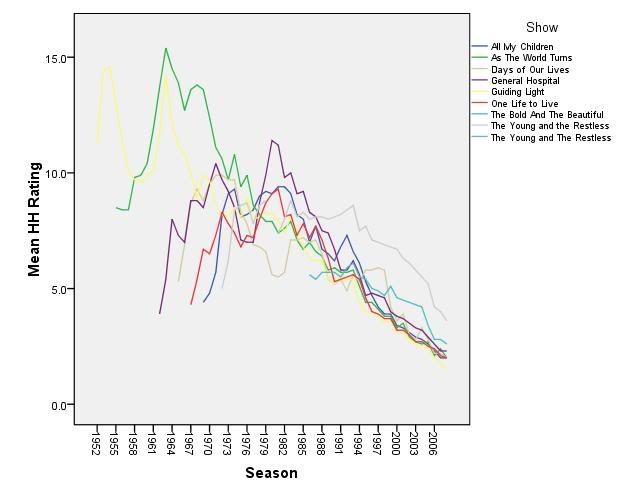
If you ignore the 1950s (where rapid expansion of televisions and television options meant the ratings fluctuated widely, and really aren't so comparable to the "saturated market" ratings we've had since the 1960s and beyond), you see a very clear general trend of growth through the mid-1970s, and then a very clear decline trend ever since. Now, there are some interesting local peaks (GH in the early 1980s; Y&R in the early 1990s), but for the most part all the soaps have moved in lockstep, downward, since the mid-70s.

This is so relentless and universal a trend IT CANNOT BE BLAMED on the creative state of any show or any regime! We really can only blame things like the growth of tv (cable) and non-tv (internet, games) options, the movement of women out of the house, the reduction in intergenerational viewership due to multi-TV households, etc.

The eye does not lie. That is pretty much a STRAIGHT LINE, and it began in the late 70s or early 80s. THERE IS NOTHING SPECIAL about the decline we see today. It is nothing but a "dying off" process (loss of viewers without replacement, at a fairly steady rate) that began almost 3 decades ago.

Oh, if only I could have a nickel every time someone said "the creative state of soaps today is so lousy, and that is why we're losing viewers". Uh uh! The rate of loss is no more significant now than it was 20+ years ago--when some shows were thought to be at Marland-esque, Bell-esque etc. creative heights.

Oh, if only I could have a dime every time someone said "if only TPTB would do such-and-such, ratings would go up." (This probably includes promotion...although I think more promotion might be able to be the one thing that built slight audience growth). Uh uh. NOTHING--not even the blockbuster of Luke and Laura--could stem the trend. If you look at GH in the early 80s, you see that it definitely spiked TEMPORARILY due to that incredible storyline. It clearly brought new viewers into the system. But it COULD NOT LAST (and it didn't), because larger demographic trends were dragging the shows down.

And I want a dollar everytime someone blames OJ Simpson! If you focus your eyes on the early-mid 1990s in the graph above. I defy you to find any significant deviation in HH ratings decline trends! If OJ had not existed, the declines would have been EXACTLY the same. I'll try to show this more clearly below.

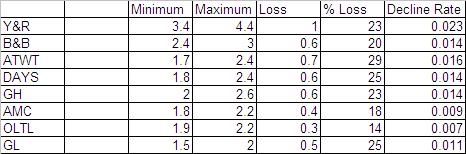
The table below tries to show the phenomenon in a different way. Averaging across all shows that were on at any given time, the figure shows the minimum and maximum ratings in each decade. Again, don't trust the 1950s data, because the new technology (TV) and explosive growth of households and viewing options really messes up those numbers


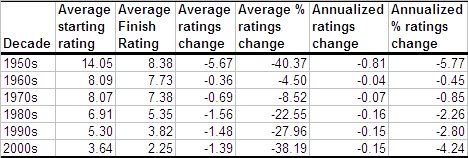
First, focus on second-last column, annualized ratings change. Note that, in every decade, the trajectory has been decline. Second, note that the rate of decline has been EXACTLY THE SAME in the 1980s, 1990s and 2000s. The rate of decline DOUBLED from the 1960s to the 1970s, and it DOUBLED AGAIN in the 1980s. Since then, it has been a fairly CONSTANT loss of 0.15 per year.

From this perspective, it again reminds us THAT NOTHING SPECIAL is happening now. Soaps are not in some "sudden freefall". They are in a constant decline.

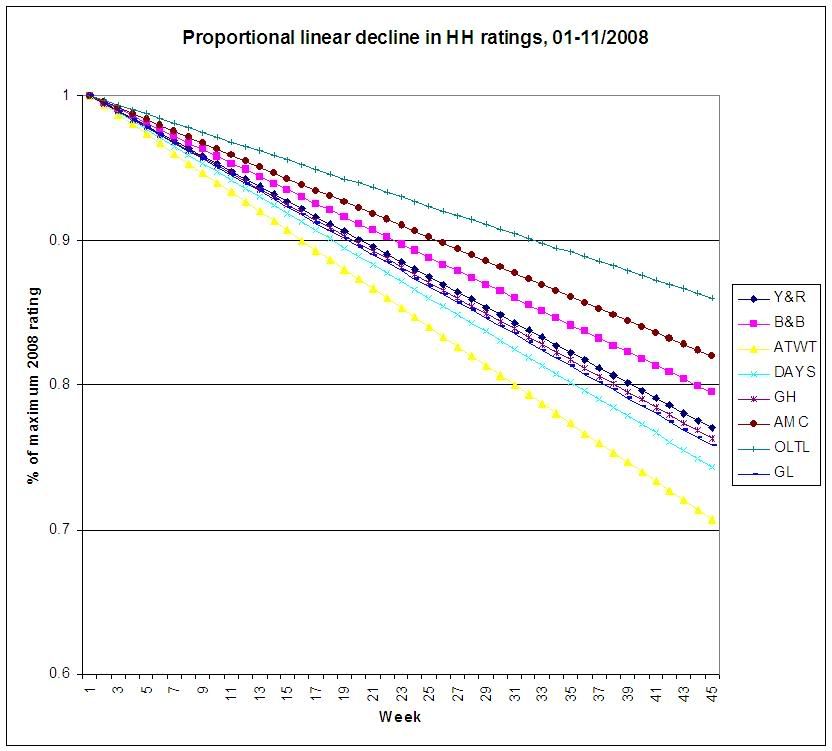
On the other hand, the far right column shows us the consequences of this steady viewer loss in the face of a smaller-and-smaller shinking base. This shows us the % of viewers lost annually in each decade. (In other words, of the viewers who started the decade, what percent of those viewers were lost, on average, in each year of that decade?). As you can see, because the number of viewers is smaller and smaller, the steady loss of viewers represents an ever larger proportion each decade.

The current decade evinces about an annual 5% loss...which means (in the 2000s) the steady viewer loss indicated that, of those who started the decade, only about half remained as viewers as we near the end of the decade.

We see this most alarmingly in another post I shared recently, that said GL/ATWT lost about 30% of their viewers in the last year. (Canadian TV Guide further added that GL lost about 21% of its desirable demo during the same period). Those proportions seem apocalyptic...but they are really only that large because of the steady rate of viewer loss over a smaller and smaller viewer base.

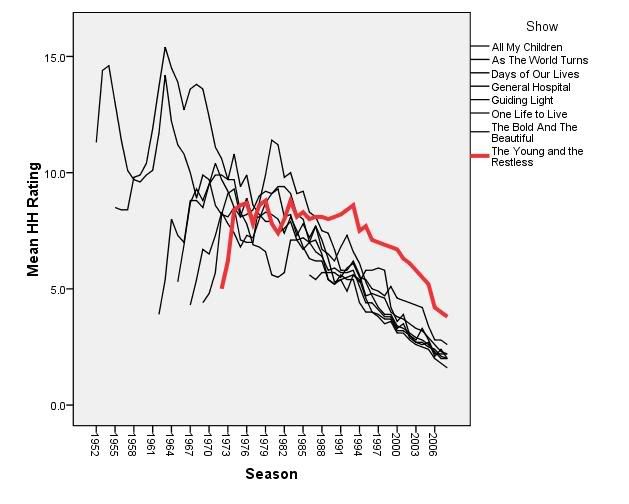
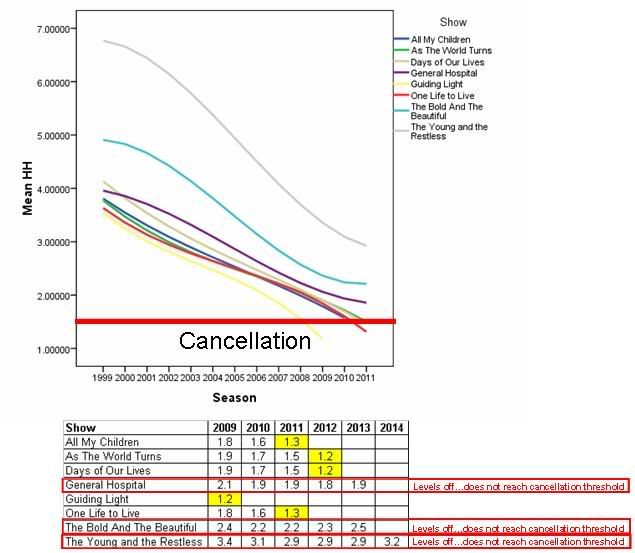
Does that mean, for example, that Ellen Wheeler is NOT the anti-Christ? Well, from a long-haul perspective, GL is 
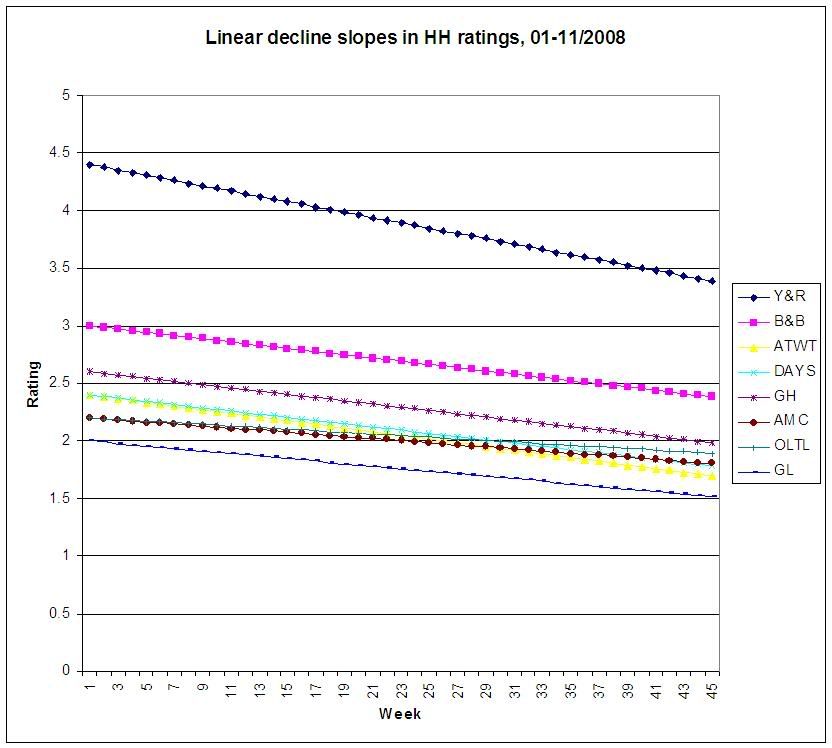
not visibly declining at an appreciably faster rate than the other soaps. However, if you take a magnifying glass to that "yellow line" representing GL in the graph above, you see that GL was never really above the middle of the ratings pack, and tended to the bottom of the pack twenty years ago. Whoever oversaw THAT relative loss of ranking is much more responsible for where GL is today than Ellen Wheeler. On the other hand, if you peer at 2007-2008 with your magnifying glass, you'll see that the distance between bottom-ranked GL and the next highest soap has widened just a bit. GL has declined just a little faster than the other soaps. (From the beginning to the end of this year, GL lost 30% of its viewers, but Y&R lost about 25%). That doesn't actually seem like an impeachable offense.

Seriously, the overall market trends are driving this. I honestly believe Douglas Marland and Beverley McKinsey could return from the beyond, and GL ratings would still be where they are. The production model could have stayed the same or become more sumptuous, and still the ratings would be where they are. That is because demographic and social forces outside of soaps are causing all of this. In that sense, Wheeler's new production model is a bright strategy! By reducing the cost of producing a soap that would do no better if there were more investment, she at least keeps people employed a little longer.

Sorry for this long-winded post, but there are two final conclusions.

A. Follow the lines, and draw your conclusions. Those of us who love the soap genre MUST prepare to let go SOON. The trend is unmistakeable, universal, continuous, and is based in at least 30 years of history. If we want our soap fix, we'll have to find it online, or in primetime, or in books, or whatever. This TV business model for soaps is utterly unsustainable.

B. We have now reached the point where the ratings are so low, most soaps have needed to implement austerity plans. The cost-cuts are so deep that viewers are noticing (GL's production model, ATWT's minimal sets, ABC's 50% cuts, Days' 40% cuts and firing of its' signature stars).

It may be time to send a different, activist voice to the networks...which is to let our "loved ones" die. We understand that the business is no longer sustainable, and we'd much rather see our shows go out on a strong note, than dwindle into local-access-cable-amateur levels.

Even if active decisions to pull the plug do not happen, our soaps will be gone very-very soon. GL and ATWT are rumored to have 2009 contract extension possibilities (bringing them to 2010), but a September-2009 sayonara for GL is widely rumored. So, too, Days' contract renewal has been much publicized as going to September 2010, and Ken Corday seems very pessimistic about further renewals. It seems to be dependent on certain performance benchmarks that seem (given the figure above) unlikely to occur. If GL/ATWT/Days are all gone by 2010, that leaves us the ABC lineup and Y&R/B&B. With ABC is massive cost cutting (50% cuts and the cancellation of SuperSoapWeekend), these numbers strongly suggest that it hardly seems likely that they can lag much behind in cancellation.

Thursday, November 20, 2008

Weekly decline %

Here is another shocking figure. Based on their 2008 maximums, what % of viewers are soaps shedding EVERY WEEK in 2008?

(I know that soaps go up and down from week to week, but when you look at the long-haul trend, what % of viewers were lost, on average, weekly in 2008?)

GL 0.70% lost weekly
ATWT 0.67% lost weekly
DAYS 0.58% lost weekly
GH 0.54% lost weekly
Y&R 0.52% lost weekly
B&B 0.47% lost weekly
AMC 0.41% lost weekly
OLTL 0.32% lost weekly

Makes me numb.....

GL is the new low

Earlier this week I reported that ATWT, with its 30% loss of viewers (between the maximum and minimum of the calendar year) was the biggest proportional loser of viewers in 2008.

Well, ratings released today at SON show GL hit a new household low rating of 1.4. With that, GL takes the "biggest loser" slot, with a loss of 31%.

I am not a regular viewer of GL, so I cannot comment on the show's creative state. Casual readers of the soap fan networks reveals that many long time viewers do not like GL's new production model, but more importantly, they feel the show has little narrative connection to its' history. Most fan favorites are gone or rarely seen, and some claim there are few intersecting stories with long-term payoff. I don't know if any of that is true.

I know that constant doom-filled signs for GL bring me no joy. Daytime's most venerable soap should not fade out like this. For a long time it has not been helped by less than 100% clearances on CBS and a wide array of timeslots (e.g, 10 am in New York).

At the point, with the clearly faster-rate-of-decline than other shows (ominous since the show was already at the bottom of the heap), it seems clear that fans have not accepted the new writing style or production model. While I applaud the experiment (I have in another post), if this were a drug trial, it would be time to say "stop--the experimental drug is killing the patient".

In contrast, two of the other bottom soaps (OLTL, AMC) have experienced much less proportional decline this year...and lately there are some hints of rebound

Now what, for GL?

There are signs that GL is trying some repair. Heralded returns of Grant Alexander, David Andrew McDonald might...just might...suggest that the show realizes it needs some anchor in popular legacy characters.

At the same time, the history of daytime soaps shows that when fans leave, they don't come back, and new viewers do not replace them (Jack Peyton axiom).

It really is like watching cancer ravage a loved one, and nothing can stop it. There comes a place when you pray for euthansia or merciful release. As a long-time viewer of another soap (Y&R), a piece of my soul -- really, I'm not being melodramatic -- will be lost forever when that show dies. But at some point I'd rather see that than what seems to be happening to GL now.

Monday, November 17, 2008

Is Y&R the big loser of 2008? I think it might be ATWT

Roger Newcomb wrote last Friday that Y&R lost the most viewers in 2008. In absolute terms, he is right. But a different cut of the numbers tells a different tale...and suggests (to me) that ATWT is in the greatest jeopardy.

This is really an archive of two posts I did at Soap Opera Network.

When it comes to ratings, I am all about "the trend".

So, the week-to-week ratings are less interesting to me, except insofar as they speak to the larger trend.

Below is the SON/Toups' ratings from the first week of the year (beginning 12/31/07) through the present, in summary form. I did this table on the HH ratings, but you get pretty similar results if you use the # of viewers. I realize the 18-39 female demo is the important one...but I'm more interested in the total eyeballs watching soaps.


I started thinking about this in reaction to Roger Newcomb's post on Friday, where (in the process of chiding SOD for their endless Victor covers) he said, in effect, Y&R lost the most viewers in the last year (800K), so why over-promote that show?

I replied at his blog and in mine, but I really wondered about the true declines for all soaps this year.

So, in the table above, I looked at the highest and lowest HH for each show. I take this as the much more useful index of decline, acknowledging that the minimum may be a point lower than the "usual low" for some shows. But still...

Suddenly, it gets hard to say "one show declined more than all others". It is true, in absolute viewers, Y&R lost the most, but if you look at % loss, the real losers are ATWT, GL and Days, with Y&R and GH in close behind.

(Now, Days and ATWT have both rebounded a little from their lowest ratings of the season...but in general I believe each show's minimum is a good reflection of where they are headed).

This is gasp-inducing. Pretty much 20-25% (1/5 to 1/4 of the audience!!!) losses across the board!! In that context, the relative preservation of AMC/OLTL is interesting...and makes one wonder if those shows have bottomed out, and have reached a stable minimum.

Now, elsewhere, I have said that the encouraging news from Soapnet, DVR viewing, and (I surmise...no numbers) online viewing suggest that these free-falls may not be quite as bad as they seem. Some of it may represent a movement away from broadcast.

But, with these numbers, our broadcasters and producers need to do a MUCH better job of following the people, and showing us where the people went. Because these numbers sure look like monotonic, unfettered decline!

With a quarter of the residual audience lost in a year, is it ANY WONDER that the networks have no interest in showing the Daytime Emmys anymore??

===

One more ratings-related post.

I thought it might be useful to look at the linear decline trajectories in the soaps this year. These are based on the maximum - minimum figures from my last post, averaged over the 45 weeks of season-to-date.

If you look at the raw ratings falls (first graph), it does look like Y&R experienced the most loss (and they did...in absolute terms).

The second graph may be more meaningful, because it puts all the shows in a common metric, and shows the decline from their 2008 high proportionally. If you can get over how appalling the overall slope of ALL the lines is, it sure makes you want to be AMC or OLTL smile.gif.


Saturday, November 8, 2008

Did I say no hope? Scratch that...

While we sit here and lament the demise of soaps, CBS' Y&R is kicking ASS. Viewership approaches the classic days of yore...just in new ways.

1. Broadcast Neilsen ratings are at an all time low for Y&R on CBS. Last week's average household rating was an all-time low of 3.4. Surely I'm delusional? Not really.

2. Soapnet, in October, reported an all-time high. This ends up adding about 15% to the total number of Y&R viewers.

3. Sara Bibel says seven-day DVR plays of Y&R add almost 25% to Y&R's audience.

4. We don't know how many people are watching the many legal online streams of Y&R, but it must be a lot. Unknown numbers at cbs.com, hulu, fancast, msn tv, legal Youtube...unknown, BUT think of this: EVERY WEEK, on their home page, CBS lists Y&R as one of their "most popular" streamed shows (no other soaps)

I have been as noisy as the rest of us about the "decline of soaps" and "the end is near" and all that jazz. But it is easy to look at these broadcast Neilsen trends and think all is lost. But when you ADD IN the numbers from these different venues, you suddenly realize that it is not out of the question that Y&R reaches 8-10 million people a day.

8-10 MILLION (and that could be an underestimate, since I have no clue what the online numbers are...that 8-10 million number could come from just Soapnet + delayed DVR views)!

A DAY!

What it says (and I can't speak to the rest of the daytime lineup) is that Y&R is still pulling numbers that aren't so far off from its' glory days!

It also says that if the chief revenue model still relies on same-day ad rates on CBS broadcast...well, then we're all f*cked.

If almost half your viewers are watching your show in other ways....they need to count...and you need to get the revenues from those other venues.

For me, meanwhile, I'm retreating from the doom and gloom a bit. These combined Y&R numbers are AMAZING...and they rival some of primetime viewership. The future is HERE. The audience is still HERE. Let's catch up with the business model!