
This is really an archive of two posts I did at Soap Opera Network.
When it comes to ratings, I am all about "the trend".
So, the week-to-week ratings are less interesting to me, except insofar as they speak to the larger trend.
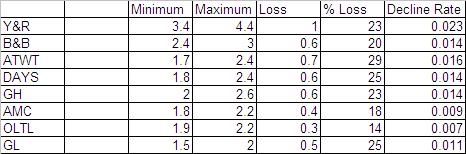
Below is the SON/Toups' ratings from the first week of the year (beginning 12/31/07) through the present, in summary form. I did this table on the HH ratings, but you get pretty similar results if you use the # of viewers. I realize the 18-39 female demo is the important one...but I'm more interested in the total eyeballs watching soaps.
I started thinking about this in reaction to Roger Newcomb's post on Friday, where (in the process of chiding SOD for their endless Victor covers) he said, in effect, Y&R lost the most viewers in the last year (800K), so why over-promote that show?
I replied at his blog and in mine, but I really wondered about the true declines for all soaps this year.
So, in the table above, I looked at the highest and lowest HH for each show. I take this as the much more useful index of decline, acknowledging that the minimum may be a point lower than the "usual low" for some shows. But still...
Suddenly, it gets hard to say "one show declined more than all others". It is true, in absolute viewers, Y&R lost the most, but if you look at % loss, the real losers are ATWT, GL and Days, with Y&R and GH in close behind.
(Now, Days and ATWT have both rebounded a little from their lowest ratings of the season...but in general I believe each show's minimum is a good reflection of where they are headed).
This is gasp-inducing. Pretty much 20-25% (1/5 to 1/4 of the audience!!!) losses across the board!! In that context, the relative preservation of AMC/OLTL is interesting...and makes one wonder if those shows have bottomed out, and have reached a stable minimum.
Now, elsewhere, I have said that the encouraging news from Soapnet, DVR viewing, and (I surmise...no numbers) online viewing suggest that these free-falls may not be quite as bad as they seem. Some of it may represent a movement away from broadcast.
But, with these numbers, our broadcasters and producers need to do a MUCH better job of following the people, and showing us where the people went. Because these numbers sure look like monotonic, unfettered decline!
With a quarter of the residual audience lost in a year, is it ANY WONDER that the networks have no interest in showing the Daytime Emmys anymore??
===
One more ratings-related post.
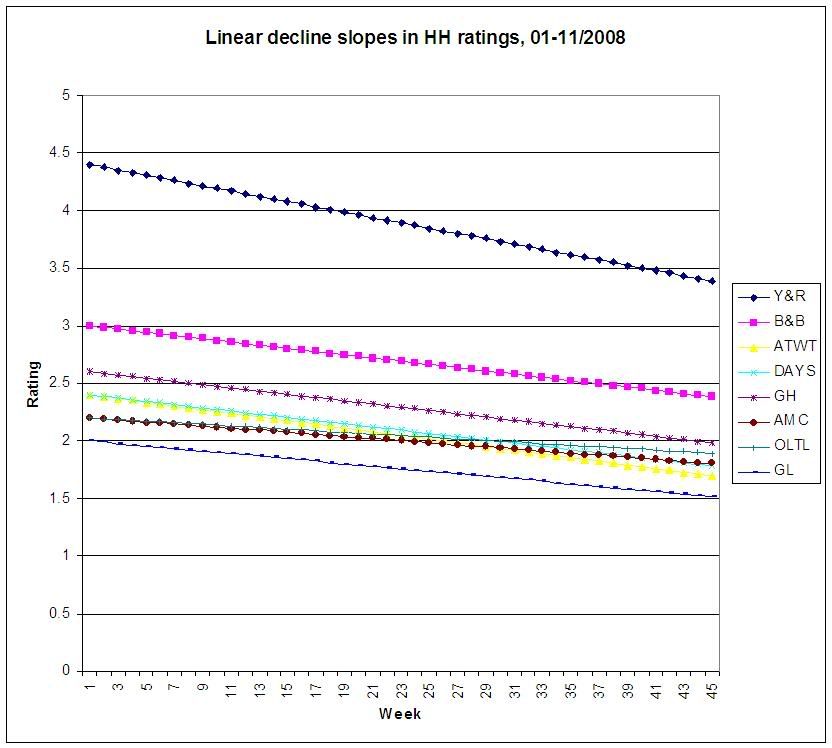
I thought it might be useful to look at the linear decline trajectories in the soaps this year. These are based on the maximum - minimum figures from my last post, averaged over the 45 weeks of season-to-date.
If you look at the raw ratings falls (first graph), it does look like Y&R experienced the most loss (and they did...in absolute terms).
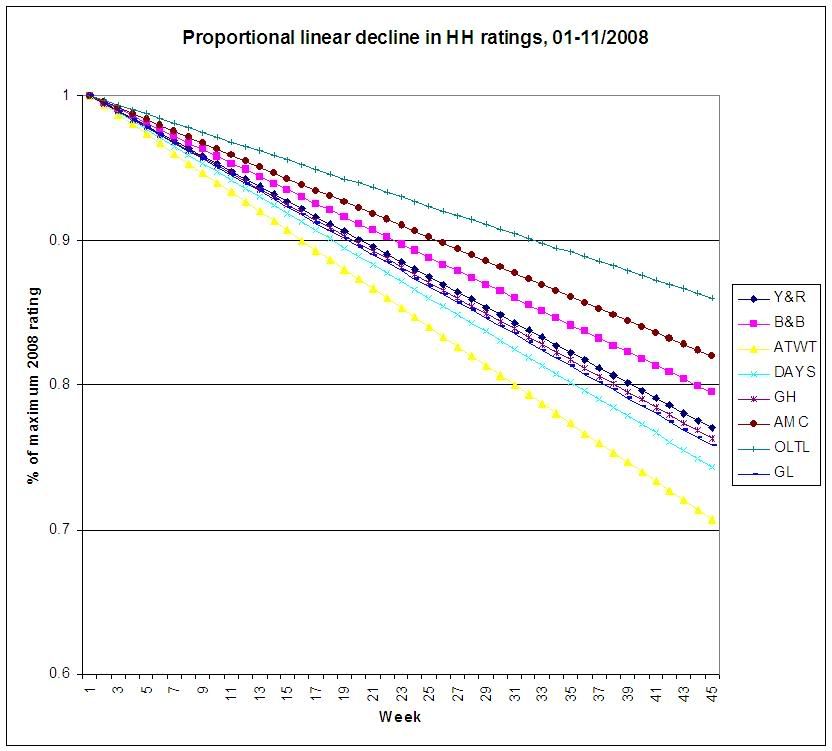
The second graph may be more meaningful, because it puts all the shows in a common metric, and shows the decline from their 2008 high proportionally. If you can get over how appalling the overall slope of ALL the lines is, it sure makes you want to be AMC or OLTL .
.
I thought it might be useful to look at the linear decline trajectories in the soaps this year. These are based on the maximum - minimum figures from my last post, averaged over the 45 weeks of season-to-date.
If you look at the raw ratings falls (first graph), it does look like Y&R experienced the most loss (and they did...in absolute terms).
The second graph may be more meaningful, because it puts all the shows in a common metric, and shows the decline from their 2008 high proportionally. If you can get over how appalling the overall slope of ALL the lines is, it sure makes you want to be AMC or OLTL
.
3 comments:
Mark, these charts rock my world. THANK YOU!!!
Love the charts, Mark. They are depressing, but so concise!! Thank you.
EGADS. If I was an EP in daytime, your charts would keep me up at night. Thanks for taking the time to put them together. They're really put things in perspective. I hope TPTB are looking at them.
Post a Comment